

Every month we take a closer look and drill down the sales data of Ottawa condos from the previous month. Here are the statistics for October 2025 in the top five "downtown" areas - Centretown, Byward Market and Sandy Hill, Little Italy (which includes Lebreton Flats), Hintonburg, and Westboro. The information will be specific to apartment-style condominiums, and only what is sold through the MLS. Also important to note that DOM (Day's On Market) is calculated to include the conditional period, which in Ottawa is roughly 14 days for almost every single transaction.
Ottawa’s Housing Market Slows Into Winter as Supply Builds: What Buyers and Sellers Should Know
Ottawa moved into a softer, slower market this November, shaped by early winter weather, caution around the economy, and rising inventory across several property types. While the market is still considered balanced overall, the numbers show a clear shift toward higher supply, especially in the apartment and townhome segments.
For anyone planning to buy or sell in 2026, these trends matter. Below is a straightforward breakdown of what changed, why it changed, and how it affects your next move.
Understanding November’s Market: Sales Down, Prices Holding Steady
Sales slowed more than usual for November. A total of 880 homes sold across Ottawa, down from 1,177 in October and 18.2 percent lower than last November. Even with the monthly drop, year-to-date sales remain slightly ahead of 2024, sitting 1.5 percent higher than the same time last year.
Prices remained resilient. The average sale price for November was $680,496, about two percent higher than last year. The year-to-date average is just under $700,000, a three percent annual increase. These steady price gains are mostly driven by single-family homes, which continue to outperform other property types. In November, single-family homes averaged $825,827, up 4.8 percent year over year.
Where the Market Is Loosening: Supply Continues to Rise
If sales tell us how much activity is happening, supply tells us how much choice buyers have. This is where Ottawa is seeing the biggest shift.
Active listings in November reached 3,721. While this is down slightly from October, it is still more than 30 percent higher than last year. This increase is not just seasonal. It is part of a larger trend toward more available inventory, which gives buyers more breathing room and puts pressure on sellers to price strategically.
Months of inventory (MOI), a key indicator of supply, rose to 4.2. For reference, anything around four months is considered balanced, while higher numbers signal a move toward a buyer’s market. The difference between property types is important:
Single-family homes: 4.0 months
Townhomes: 3.1 months
Apartments: 7.3 months
Apartments are clearly the most oversupplied segment right now. Sales were down more than a third compared to last year, and MOI has climbed above seven months. Prices have remained relatively stable, but the amount of available condo product indicates a softer environment than the average sale price suggests.
Townhomes are seeing some pressure as well. The average price in November fell to $542,607, down from both last month and the year-to-date average.
How Ottawa’s Condo Market Compares to Other Cities
Ottawa is not facing the extreme condo inventory buildup currently seen in Toronto, where years of new completions and rising resale listings have created downward pricing pressure. However, Ottawa’s rising apartment inventory is real and worth watching. Roughly 70 percent of new housing starts this year have been multi-unit buildings, meaning more supply will come online over the next few years.
Even though this pipeline does not impact prices immediately, it shapes long-term expectations for both buyers and investors. The key will be watching whether condo listings continue to rise faster than sales through the winter.
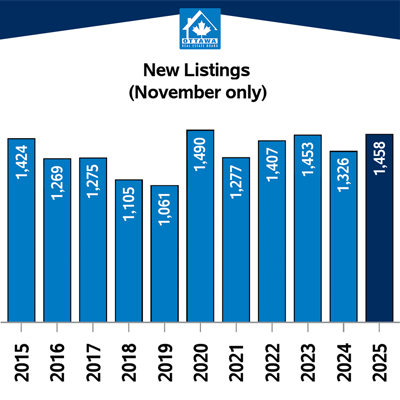
New Listings and Market Activity: What’s Entering the Market
New listings in November totalled 1,458. This is down 39 percent from October, which is normal for late fall, but still 10 percent higher than last November. This tells us sellers are not pulling back as dramatically as usual, contributing to the elevated supply levels we are seeing.
Despite slower monthly activity, the market overall remains steady from a financial standpoint. Year-to-date sales exceed $9 billion, up 4.6 percent from last year.
What Buyers Should Take Away
• There is more choice than at any point in the past five years
• Sellers are more flexible on price, especially in condos and townhomes
• Rate cuts may improve affordability heading into the new year
• Inventory is trending up, which reduces urgency and allows for more strategic shopping
For buyers who were discouraged over the past few years, this is one of the most favourable winter markets Ottawa has seen recently.
What Sellers Should Take Away
• Pricing and presentation matter more in a higher-supply environment
• Single-family homes remain the strongest segment
• Condo sellers should expect longer days on market
• Listing strategy should be tailored to current conditions, not last year’s comparables
Even in a balanced market, the right positioning and marketing can make a noticeable difference in interest, showing activity, and final sale price.
Ottawa enters the winter season with a market that is still stable but clearly tilting toward higher supply. Sales are slower, inventory is rising, and condos and townhomes are under the most pressure. At the same time, prices remain steady, and recent rate cuts could encourage more buyers to re-enter the market sooner than typical winter patterns would suggest.
For buyers, this is a window of opportunity. For sellers, it is a moment to be strategic. As always, the best decisions come from understanding how market trends impact your specific property type and neighbourhood. If you have questions about how this data applies to your plans, a conversation with a local expert can help you choose the right next step.


Important to note is that these statistics can only be as accurate as there are condos sold in Ottawa. The more condos sold in an area, the more accurate the averages will be.
Want to chat about your options? Fill out the form at the bottom of the page, or text/call us directly at 613-900-5700 or fill out the form at the bottom of the page.
Do you have any questions about how this information affects your investment or looking for more information to make the best decision about your purchase? Let’s chat! Fill out the form on the bottom of the page.


