Westboro Condos

Ottawa Condo Market Statistics - November 2024

Every month we take a closer look and drill down the sales data of Ottawa condos from the previous month. Here are the statistics for November 2024 in the top five "downtown" areas - Centretown, Byward Market and Sandy Hill, Little Italy (which includes Lebreton Flats), Hintonburg, and Westboro. The information will be specific to apartment-style condominiums, and only what is sold through the MLS. Also important to note that DOM (Day's On Market) is calculated to include the conditional period, which in Ottawa is roughly 14 days for almost every single transaction.


Ottawa Real Estate Market Update: November 2024

The Ottawa real estate market in November 2024 is showing promising signs of recovery after the slowdown experienced in 2023. With increased activity in year-to-date sales and rising inventory levels, the market is steadily regaining momentum, even as seasonal trends begin to cool activity. Here's a detailed look at the numbers and what they mean for buyers and sellers.

Home Sales and Pricing Trends In November 2024, a total of 1,059 homes were sold through the MLS® System of the Ottawa Real Estate Board (OREB). While this reflects a slight decrease from October's 1,179 sales, it marks an 11.8% year-to-date increase compared to 2023, underscoring a recovery in market activity.

Prices are holding steady, with the benchmark price for a single-family home at $722,400, up 2.1% year-over-year. Townhomes saw a modest increase of 0.3%, reaching $491,500, while apartments experienced a slight decline to $406,200, down 3.7% compared to last year. The average sale price in November was $667,098, a notable 4.6% increase year-over-year, reflecting stable demand despite economic uncertainties.

Inventory and Listings The number of new listings in November totaled 1,352, a 7.3% decrease compared to last year, while active residential listings surged by 38.2%, with 4,036 homes on the market. Months of inventory stood at 3.8, slightly down from 4.0 in November 2023, indicating a balanced market where neither buyers nor sellers hold a significant advantage.

The uptick in inventory compared to previous years is a welcome sign for buyers who have been navigating a market with limited options over the past few years. Sellers, on the other hand, may need to adjust expectations as buyers proceed cautiously, awaiting further interest rate adjustments and upcoming mortgage rule changes.

Key Factors Shaping the Market OREB's Past-President, Curtis Fillier, highlighted several trends impacting buyer and seller behavior:

  • Buyers are exercising caution, closely watching interest rates and preparing for December's new mortgage rules, including extended amortization periods and higher default insurance caps, which could redefine purchasing power.

  • Sellers are holding off for the typically busier spring market, with many focusing on maintaining competitive pricing and showcasing properties effectively during the slower winter months.

A Look Ahead As the year winds down, seasonal slowdowns are expected as attention shifts to the holidays. However, with prices remaining steady, increased inventory, and open houses continuing to attract interest, the market remains active. Buyers looking for opportunities and sellers preparing for the upcoming spring market should take note of these dynamics.

What This Means for You For buyers, now may be a good time to explore opportunities, especially in the apartment market, where prices have softened. Sellers should focus on preparing their homes to stand out in a market with rising inventory levels. Whether you're buying or selling, staying informed and working with a trusted real estate professional can help you make the most of the current market conditions.

The Ottawa market is making headway on its road to recovery, and 2025 promises to be an exciting year as new policies and market trends continue to shape the landscape. Stay tuned for more updates and insights to navigate Ottawa’s dynamic real estate market effectively!

Important to note is that these statistics can only be as accurate as there are condos sold in Ottawa. The more condos sold in an area, the more accurate the averages will be.

Want to chat about your options? Fill out the form at the bottom of the page, or text/call us directly at 613-900-5700 or fill out the form at the bottom of the page.

Do you have any questions about how this information affects your investment or looking for more information to make the best decision about your purchase? Let’s chat! Fill out the form on the bottom of the page.


Ottawa Condo Market Statistics - October 2024

Every month we take a closer look and drill down the sales data of Ottawa condos from the previous month. Here are the statistics for October 2024 in the top five "downtown" areas - Centretown, Byward Market and Sandy Hill, Little Italy (which includes Lebreton Flats), Hintonburg, and Westboro. The information will be specific to apartment-style condominiums, and only what is sold through the MLS. Also important to note that DOM (Day's On Market) is calculated to include the conditional period, which in Ottawa is roughly 14 days for almost every single transaction.


Market Outlook Reflects Growing Consumer Confidence in Ottawa’s Resale Housing Sector

In October 2024, the Ottawa Real Estate Board (OREB) reported 1,179 properties sold through its MLS® System, marking an increase from 1,047 in September. Although sales remain 3.9% below the five-year average and 0.9% below the ten-year average for October, the market continues to show resilience with steady, year-round activity instead of the usual seasonal patterns.

On a cumulative basis, 11,662 homes have been sold year-to-date in 2024, which represents a 9.4% increase over the same period in 2023. OREB President Curtis Fillier notes that this consistent demand is bolstered by a gradual rise in consumer confidence, particularly following a recent Bank of Canada interest rate cut. “The boost in consumer confidence is evident, though many prospective buyers await further reductions in borrowing costs.”

The recent rate adjustment may alleviate some pressure, but market conditions remain challenging due to constrained housing supply. The Ontario government’s latest economic outlook scaled back housing starts for 2024 to 81,300 units, a significant shortfall from its target of 125,000 homes. This downward revision reflects broader economic constraints, including elevated interest rates that continue to affect builders’ ability to launch new projects.

Fillier emphasizes that inventory challenges remain paramount in Ottawa. "Our market often operates with tight inventory, rapidly shifting from balance to a seller’s market. More innovative policies and new inventory solutions are essential to support housing affordability and accessibility."

Housing Supply Advocacy and Strategic Solutions
OREB has recently partnered with the Canadian Real Estate Association in advocating for enhanced housing supply strategies. In meetings with federal policymakers, REALTORS® outlined proposals to expand housing access, including promoting offsite construction technology (such as prefabricated homes) and extending tax relief for non-profit affordable housing projects.

Price Trends
The MLS® Home Price Index (HPI) continues to offer a comprehensive view of pricing trends across property types. In October 2024:

  • The overall HPI benchmark price for residential properties was $639,500, reflecting a 0.4% increase year-over-year.

  • The benchmark price for single-family homes rose to $724,500, up 0.7% from last year.

  • Townhouse/row unit benchmark prices increased by 1.6% to $506,900.

  • The benchmark apartment price declined by 3.4% to $407,500.

The average sale price for homes sold in October reached $668,690, up 1.2% year-over-year, while the year-to-date average price rose to $678,081, a 0.9% increase from October 2023. The total sales volume for October 2024 was $788.3 million, marking a 47.7% gain from last year.

OREB advises that while average prices provide an overall trend, they are not definitive indicators of specific property value changes, as neighbourhood variations significantly impact prices.

Inventory and New Listings
New residential listings for October 2024 totalled 2,089, representing a 10.4% increase over the previous year. New listings are notably above both the five- and ten-year October averages, at 6.7% and 17%, respectively. Active listings reached 3,354, an 8.9% increase from last October and significantly higher than the five-year average (40.6% above) and ten-year average (6.7% above).

The months of inventory declined to 2.8, down from 3.8 in October 2023, indicating a tightening supply relative to sales activity.

This upward shift in consumer confidence, coupled with proactive advocacy for housing supply innovation, underscores Ottawa’s potential for continued stability and growth in its real estate market.

October 2024 Market Highlights

  • Total Properties Sold: 1,179 units were sold via the Ottawa Real Estate Board’s MLS® System, reflecting a notable increase from September’s 1,047 units, though sales were 3.9% below the five-year October average.

  • Benchmark Prices:

    • Single-Family Homes: The benchmark price for single-family homes was $724,500, marking a 0.7% year-over-year increase.

    • Apartments: Benchmark prices for apartments declined 3.4%, settling at $407,500.

    • Overall Composite Price: The MLS® Home Price Index (HPI) composite benchmark for Ottawa was $639,500, a slight 0.4% increase from October 2023.

    • Average Sale Price: The average price of homes sold in October was $668,690, a 1.2% year-over-year increase.

  • New Listings: Ottawa saw 2,089 new residential listings in October, an increase of 10.4% from October 2023. This figure is 6.7% above the five-year October average and 17% above the 10-year average, indicating a healthy influx of properties into the market.

  • Active Listings and Days on Market:

    • Active Listings: At the end of October, there were 3,354 active listings, up 8.9% from the previous year, and 40.6% above the five-year October average.

    • Days on Market: Properties averaged 24 days on the market, reflecting efficient sales turnover in the current environment.

Important to note is that these statistics can only be as accurate as there are condos sold in Ottawa. The more condos sold in an area, the more accurate the averages will be.

Want to chat about your options? Fill out the form at the bottom of the page, or text/call us directly at 613-900-5700 or fill out the form at the bottom of the page.

Do you have any questions about how this information affects your investment or looking for more information to make the best decision about your purchase? Let’s chat! Fill out the form on the bottom of the page.

Ottawa Condo Market Statistics - September 2024

Every month we take a closer look and drill down the sales data of Ottawa condos from the previous month. Here are the statistics for September 2024 in the top five "downtown" areas - Centretown, Byward Market and Sandy Hill, Little Italy (which includes Lebreton Flats), Hintonburg, and Westboro. The information will be specific to apartment-style condominiums, and only what is sold through the MLS. Also important to note that DOM (Day's On Market) is calculated to include the conditional period, which in Ottawa is roughly 14 days for almost every single transaction.


Ottawa Real Estate Market Update: A Healthy Outlook Amid a Shifting Market

The Ottawa real estate market continues to demonstrate resilience as we move through a shifting housing landscape. According to the Ottawa Real Estate Board (OREB), a total of 1,047 homes were sold via the MLS® system in September 2024, marking an 11.4% increase from September 2023. While sales remain 17.4% below the five-year average and 15.4% below the 10-year average, the year-to-date sales figure of 10,485 units reflects a 6.4% rise from the same period in 2023.

OREB President Curtis Fillier shared an optimistic outlook, stating, "Ottawa’s fall housing market is healthy, with robust activity and steady prices." Fillier also highlighted the recalibration of buyers’ and sellers’ purchasing power due to potential interest rate cuts, longer amortizations, and increased mortgage insurance price caps.

However, Fillier noted that Ottawa’s real estate market is primarily challenged by chronic supply shortages rather than demand. Recent policy developments aimed at stimulating demand may help, but as Fillier pointed out, "Ottawa's market doesn't typically have demand problems—we're not building enough homes, and we're certainly not building enough of the right homes to address the 'missing middle.'" According to the Canada Mortgage and Housing Corporation (CMHC), population-adjusted construction in Ottawa is at its lowest level in nearly a decade, and the city is behind on its annual housing targets.

Sales Activity and Prices Year-to-Date

The MLS® Home Price Index (HPI), which offers a more accurate reflection of price trends compared to median or average prices, shows that Ottawa’s housing market remains stable:

  • The overall benchmark price for homes in Ottawa stood at $642,800 in September 2024, marking a modest 0.2% increase from September 2023.

  • Single-family homes saw their benchmark price rise by 0.5% year-over-year to $729,000.

  • Townhouses/row units experienced a slight decline, with the benchmark price falling 1.7% to $500,000 compared to last year.

  • Apartment prices also saw a year-over-year dip, decreasing by 1.3% to $414,200.

The average sale price for homes sold in September 2024 was $685,551, reflecting a 1.4% increase from September 2023. Year-to-date, the average price was $679,082, up by 0.9% compared to the same period in 2023. OREB advises that while the average sale price is useful for identifying long-term trends, it should not be interpreted as a direct indicator of property value changes in specific neighbourhoods.

The total dollar volume of home sales in September 2024 reached $717.7 million, representing a 12.9% increase from the same month in 2023.

Inventory and New Listings Year-to-Date

Ottawa’s housing supply remains tight, but the inventory is gradually recovering:

  • New listings saw a 3.9% increase year-over-year, with 2,343 residential properties hitting the market in September 2024. This number was 4.7% above the five-year average and 11.6% above the 10-year average for September.

  • Active listings at the end of September totaled 3,529 units, up 16.9% from a year ago. Active inventory levels were also 43.3% above the five-year average and 4.6% higher than the 10-year average.

  • Months of inventory, which indicates how long it would take to sell current stock at the current sales pace, stood at 3.4 months, slightly up from 3.2 months in September 2023.

Key Takeaways

Ottawa's real estate market in 2024 is showing signs of recovery and resilience despite continued supply challenges. While sales have picked up, the city remains constrained by a lack of new housing development, which contributes to the "missing middle" housing crisis. Buyers and sellers alike are adapting to shifting market conditions, including potential interest rate changes, while the market itself remains healthy with steady prices and increasing activity.

For prospective buyers, Ottawa continues to offer stable investment opportunities, especially in the single-family home sector, while townhouse and apartment prices have seen slight declines. As the fall market progresses, the key challenge remains addressing Ottawa's supply issues to keep pace with growing demand.

Important to note is that these statistics can only be as accurate as there are condos sold in Ottawa. The more condos sold in an area, the more accurate the averages will be.

Want to chat about your options? Fill out the form at the bottom of the page, or text/call us directly at 613-900-5700 or fill out the form at the bottom of the page.

Do you have any questions about how this information affects your investment or looking for more information to make the best decision about your purchase? Let’s chat! Fill out the form on the bottom of the page.

Ottawa Condo Market Statistics - August 2024

Every month we take a closer look and drill down the sales data of Ottawa condos from the previous month. Here are the statistics for August 2024 in the top five "downtown" areas - Centretown, Byward Market and Sandy Hill, Little Italy (which includes Lebreton Flats), Hintonburg, and Westboro. The information will be specific to apartment-style condominiums, and only what is sold through the MLS. Also important to note that DOM (Day's On Market) is calculated to include the conditional period, which in Ottawa is roughly 14 days for almost every single transaction.


Ottawa’s Housing Market Stays Strong as Summer Winds Down: What to Expect This Fall

Ottawa’s real estate market had an active summer, and the momentum is expected to carry into the fall. While rising home sales signal a steady market, buyers and sellers alike are navigating a landscape shaped by affordability concerns and a changing interest rate environment. Here’s a breakdown of what happened in August 2024 and what you should know moving forward.

Home Sales Climb Compared to Last Year

August 2024 saw 1,100 homes sold through the Ottawa Real Estate Board (OREB), marking a 10.2% rise from August 2023. This increase is notable because, while home sales are up from last year, they are still 11.4% lower than the five-year average for August and 14.1% lower than the 10-year average.

Year-to-date numbers are promising as well, with 9,444 properties sold so far this year, up by 6% compared to the same period last year. This trend points to a more consistent level of sales despite Ottawa’s typical seasonal fluctuations, bolstered by recent drops in interest rates.

Buyers Taking Their Time, Sellers Urged to Be Patient

Even though home sales are climbing, buyers aren’t rushing into deals. With affordability remaining a significant concern, people are being more deliberate in their decisions, carefully weighing their options before making offers. The slight uptick in new listings combined with steady pricing means buyers have more choices, but they are moving cautiously.

For sellers, this means adjusting expectations. Quick sales aren’t guaranteed, and patience is key. Real estate professionals recommend working with a REALTOR® who has access to local data and market trends. With expert pricing and strategy, homes are more likely to attract the right buyer.

What’s Happening with Prices?

While it’s tempting to look at average sale prices to gauge market performance, it’s more accurate to consider benchmark prices, which track value changes based on property types and characteristics.

  • The overall MLS® Home Price Index (HPI) for August 2024 is $646,000, down slightly by 0.3% compared to August 2023.

  • Single-family homes saw a similar slight decrease in benchmark price, now at $732,500.

  • Townhouses and row homes, on the other hand, experienced a small bump in price, rising by 0.3% to $502,200.

  • Apartments dipped a bit, with the benchmark price falling by 1.2% to $416,800.

On average, homes sold for $660,341 in August 2024, a modest increase of 0.3% from last year. For the year as a whole, the average sale price has risen by 0.9% to $678,327. These numbers show that prices are relatively stable, meaning the market isn’t swinging wildly in either direction.

The Inventory Picture: More Homes Available

The supply of available homes is a critical factor in Ottawa’s real estate dynamics. In August, 1,907 new homes came onto the market, a slight 0.2% increase compared to last August. Overall, there were 3,324 active residential listings by the end of the month, representing a 25.8% increase from a year ago.

The market is starting to offer more choices for buyers, but inventory is still tight compared to long-term trends. The months of inventory—the number of months it would take to sell all the available homes at the current sales pace—stood at 3.0 in August, up from 2.6 last year. While this is an improvement, it’s still lower than the historical average, meaning the market remains competitive for buyers.

Homes Are Selling Faster

One encouraging sign for sellers is that homes are still moving quickly. The average home was on the market for 24 days in August, reflecting strong demand despite cautious buyers. This means that, with the right pricing and marketing strategy, sellers can expect their homes to sell in under a month on average.

What Does This All Mean for You?

For buyers, the current environment offers a bit more breathing room. With interest rates trending down and more homes becoming available, it’s a good time to start looking at your options. There’s no need to rush, though—prices are holding steady, and you’ll likely have more opportunities as fall progresses.

For sellers, patience and strategy are your best friends. While the market is active, buyers are moving more cautiously, which means working closely with a knowledgeable REALTOR® to price your home correctly is essential. Marketing your home effectively will also make a difference, ensuring you attract serious buyers.

Takeaways as We Head into Fall

The Ottawa real estate market has proven resilient throughout the summer, with sales increasing and prices staying stable. As we move into fall, this momentum is expected to continue, offering opportunities for both buyers and sellers. Whether you’re looking to purchase or sell, staying informed and working with a professional will help you navigate this evolving market.


Important to note is that these statistics can only be as accurate as there are condos sold in Ottawa. The more condos sold in an area, the more accurate the averages will be.

Want to chat about your options? Fill out the form at the bottom of the page, or text/call us directly at 613-900-5700 or fill out the form at the bottom of the page.

Do you have any questions about how this information affects your investment or looking for more information to make the best decision about your purchase? Let’s chat! Fill out the form on the bottom of the page.

Ottawa Condo Market Statistics - July 2024

Every month we take a closer look and drill down the sales data of Ottawa condos from the previous month. Here are the statistics for July 2024 in the top five "downtown" areas - Centretown, Byward Market and Sandy Hill, Little Italy (which includes Lebreton Flats), Hintonburg, and Westboro. The information will be specific to apartment-style condominiums, and only what is sold through the MLS. Also important to note that DOM (Day's On Market) is calculated to include the conditional period, which in Ottawa is roughly 14 days for almost every single transaction.


Ottawa’s MLS® Market Shows Positive Trends Moving into Summer

In July 2024, the MLS® System of the Ottawa Real Estate Board (OREB) recorded 1,241 home sales, reflecting a 13.6% increase from July 2023. This rise in sales is noteworthy, especially considering the typical seasonal slowdown that often occurs during the summer months. This suggests that market activity may be picking up momentum, which could continue as we move further into the year.

Despite this growth, it's important to contextualize these numbers. Home sales were still 7.1% below the five-year average and 8.8% below the 10-year average for July. This indicates that while there is an improvement compared to last year, the market has not yet fully returned to its historical norms. However, the year-to-date sales figures, which totalled 8,349 units by July 2024, represent a 5.5% increase from the same period in 2023, showing a sustained improvement over the course of the year.

OREB President Curtis Fillier highlights the importance of buyer confidence in this trend. As buyers regain confidence, likely due to stabilizing economic conditions and recent policy changes, they are re-entering the market. Meanwhile, sellers are responding by listing more properties, contributing to a more dynamic market. However, the extent of future sales growth will depend largely on the types of properties available and their price points. Persistent issues like supply constraints and affordability challenges continue to limit the market's full potential.

The recent policy developments, including two interest rate cuts by the Bank of Canada and the federal government’s introduction of 30-year amortization periods for first-time homebuyers of newly built homes, are expected to further stimulate demand. These changes make homeownership more accessible for certain segments of buyers, particularly first-timers. However, as Fillier points out, these measures primarily address the demand side of the equation. The supply side remains a critical issue, with Ottawa and other cities across Canada needing more concrete actions to increase housing availability.

The Bank of Canada’s Monetary Policy Report points to municipal zoning restrictions and high development fees as significant barriers to increasing the housing supply. This is a longstanding issue that impacts not just Ottawa but cities nationwide. Recent data from the Ontario government underscores the severity of the problem in Ottawa, which has only achieved 12.7% of its 2024 housing starts target, with 1,593 homes built out of the 12,583 goal. This shortfall suggests that without substantial changes in zoning laws or reductions in development fees, the city will continue to struggle with meeting its housing needs.


By the Numbers – Prices:

The MLS® Home Price Index (HPI) provides a detailed view of price trends, offering a more accurate measure than simple average or median prices. In July 2024, the overall MLS® HPI composite benchmark price was $648,900, which is a slight increase of 0.1% from July 2023. This indicates that while prices have stabilized compared to last year, the market is not seeing significant appreciation, reflecting a balanced state between buyers and sellers.

The benchmark price for single-family homes was $734,700, showing a minor decrease of 0.1% year-over-year. This could be a sign that higher-end buyers are exercising caution or that there is a surplus in this segment of the market, leading to slightly lower prices.

In contrast, the benchmark price for townhouses and row units increased by 3.4%, reaching $506,100. This rise suggests that more buyers are turning to these property types as a more affordable alternative to single-family homes, driving up demand and prices in this category.

The benchmark price for apartments was $422,800, down 0.9% from the previous year. This slight decline could reflect shifts in buyer preferences or market saturation in certain areas, particularly if new apartment developments have recently been completed.

The average home price in July 2024 was $679,610, which is a 2.1% decrease from July 2023. However, the year-to-date average price stands at $681,082, representing a 1.0% increase from July 2023. This suggests that while there may have been fluctuations in monthly averages, the overall trend for the year indicates modest price growth.

The total dollar volume of home sales in July 2024 was $843.3 million, an 11.3% increase from July 2023. This growth in dollar volume, despite the decrease in average prices, suggests that the increase in the number of transactions has compensated for the slight dip in prices, indicating a healthy level of market activity.

OREB advises that while average sale prices are useful for identifying trends, they do not directly translate to changes in the value of individual properties. Prices can vary significantly depending on the neighbourhood, and the overall average may be influenced by the mix of properties sold in any given month.

By the Numbers – Inventory and New Listings:

There was a 17.1% increase in new listings compared to July 2023, with 2,231 new residential listings recorded in July 2024. This increase in new listings is encouraging, as it suggests that more sellers are willing to enter the market, likely in response to the steady demand. These new listings were 6.3% above the five-year average and 6.9% above the 10-year average for July, further indicating that seller activity is strong compared to historical norms.

Active residential listings reached 3,480 units at the end of July 2024, a significant 37.0% increase from July 2023. This rise in active listings could indicate that while more homes are coming onto the market, not all are being absorbed immediately, leading to a buildup in inventory. Active listings were 50.6% above the five-year average but 2.3% below the 10-year average, which suggests that while current inventory levels are high, they are not unprecedented.

The months of inventory, a key indicator of market balance, stood at 2.8 by the end of July 2024, up from 2.3 in July 2023. This figure represents the amount of time it would take to sell the current inventory at the current rate of sales. An increase in months of inventory typically indicates a shift towards a more balanced market, or even a buyer’s market, where buyers have more choices and potentially more negotiating power.

Overall, the Ottawa real estate market is showing signs of resilience and gradual recovery, with increases in sales and listings indicating renewed activity. However, ongoing supply challenges and affordability issues will need to be addressed to sustain this momentum in the long term.


Important to note is that these statistics can only be as accurate as there are condos sold in Ottawa. The more condos sold in an area, the more accurate the averages will be.

Want to chat about your options? Fill out the form at the bottom of the page, or text/call us directly at 613-900-5700 or fill out the form at the bottom of the page.

Do you have any questions about how this information affects your investment or looking for more information to make the best decision about your purchase? Let’s chat! Fill out the form on the bottom of the page.
Ottawa Condo Market Statistics - June 2024

Every month we take a closer look and drill down the sales data of Ottawa condos from the previous month. Here are the statistics for June 2024 in the top five "downtown" areas - Centretown, Byward Market and Sandy Hill, Little Italy (which includes Lebreton Flats), Hintonburg, and Westboro. The information will be specific to apartment-style condominiums, and only what is sold through the MLS. Also important to note that DOM (Day's On Market) is calculated to include the conditional period, which in Ottawa is roughly 14 days for almost every single transaction.


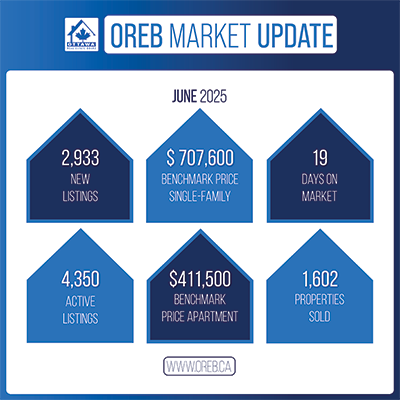
In June 2024, the Ottawa Real Estate Board (OREB) recorded 1,439 home sales through its MLS® System. This marks a slight 0.1% increase compared to June 2023.

Despite this increase, home sales in June were 7.5% below the five-year average and 13.2% below the 10-year average.

For the first half of the year, a total of 7,109 homes were sold, reflecting a 4.2% increase from the same period in 2023.

"As we enter the summer market, Ottawa is experiencing consistent activity," commented OREB President Curtis Fillier. "Unlike the past few years, buyers now have the luxury to wait, assess, and choose carefully, resulting in a minor rise in the days homes stay on the market. The inventory and listings indicate that sellers are active. After overcoming last year's slowdown, Ottawa's market performance is nearing normal levels and showing continuous improvement.

“This summer and the latter half of the year promise to be intriguing. With growing confidence, opportunities will be plentiful for both buyers and sellers. Sellers should ensure their properties are well-presented and correctly priced to attract cautious buyers. Buyers should stay alert, as inventory levels and competition can change rapidly in Ottawa's competitive market."

Price Trends

The MLS® Home Price Index (HPI) provides a more precise tracking of price trends compared to average or median price measures.

  • The overall MLS® HPI composite benchmark price in June 2024 was $647,700, down 0.5% from June 2023.

  • The benchmark price for single-family homes was $734,300, a 0.2% decrease from June 2023.

  • The townhouse/row unit benchmark price was $501,500, a 1.6% decrease from a year ago.

  • The benchmark price for apartments was $420,800, down 1.7% from June 2023.

  • The average home price in June 2024 was $686,535, up 0.5% from June 2023. The year-to-date average price was $681,345, marking a 1.6% increase from the first half of 2023.

  • The total dollar volume of home sales in June 2024 reached $987.9 million, a 0.7% increase from June 2023.

OREB notes that while average sale prices can indicate trends over time, they should not be used to infer changes in specific property values. These prices are calculated from the total dollar volume of all sales, and prices can vary significantly across different neighbourhoods.

Inventory and New Listings

  • June 2024 saw 2,469 new residential listings, a 4.7% increase from June 2023. These new listings were 0.8% below the five-year average and 1% below the 10-year average.

  • There were 3,585 active residential listings at the end of June 2024, a 45.5% increase from June 2023. Active listings were 57.8% above the five-year average and 1.9% below the 10-year average.

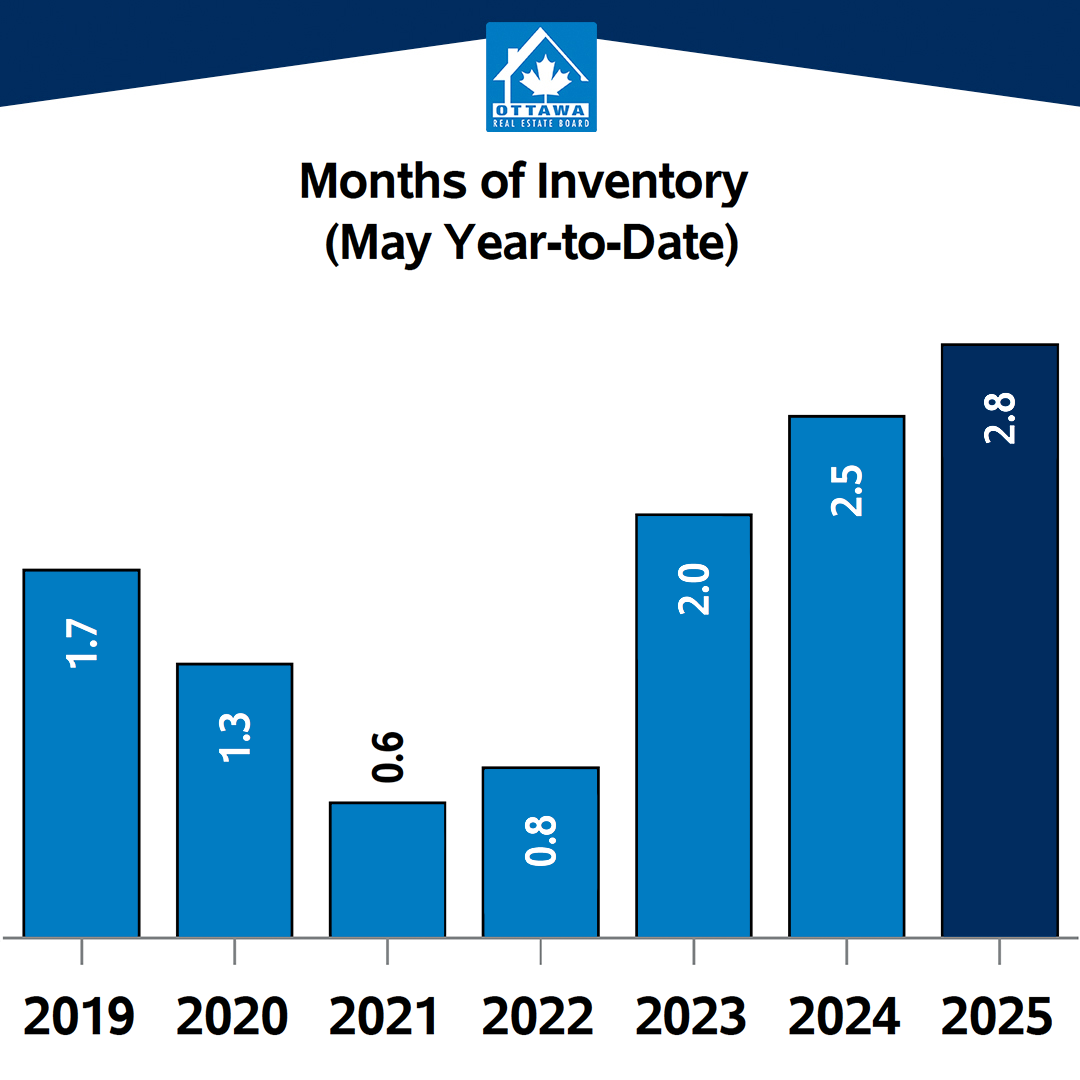
  • The months of inventory stood at 2.5 at the end of June 2024, up from 1.7 in June 2023. This indicates the number of months required to sell current inventories at the current sales rate.

Important to note is that these statistics can only be as accurate as there are condos sold in Ottawa. The more condos sold in an area, the more accurate the averages will be.

Want to chat about your options? Fill out the form at the bottom of the page, or text/call us directly at 613-900-5700 or fill out the form at the bottom of the page.

Do you have any questions about how this information affects your investment or looking for more information to make the best decision about your purchase? Let’s chat! Fill out the form on the bottom of the page.

Ottawa Condo Market Statistics - May 2024

Every month we take a closer look and drill down the sales data of Ottawa condos from the previous month. Here are the statistics for May 2024 in the top five "downtown" areas - Centretown, Byward Market and Sandy Hill, Little Italy (which includes Lebreton Flats), Hintonburg, and Westboro. The information will be specific to apartment-style condominiums, and only what is sold through the MLS. Also important to note that DOM (Day's On Market) is calculated to include the conditional period, which in Ottawa is roughly 14 days for almost every single transaction.


In May 2024, the Ottawa Real Estate Board (OREB) recorded 1,545 home sales via the MLS® System, marking a 9.2% decline from May 2023. These sales were 3.7% lower than the five-year average and 13.2% below the ten-year average for May.

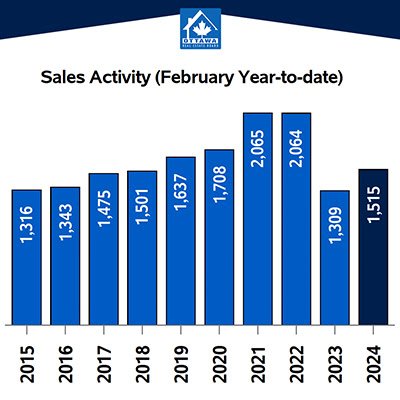
Year-to-date figures show 5,673 homes sold in the first five months of 2024, representing a 5.2% increase compared to the same period in 2023.

OREB President Curtis Fillier noted the market's steady pace in early spring. He pointed out that the rise in new listings suggests sellers are gaining confidence as market activity intensifies. However, some buyers were likely waiting for the Bank of Canada's interest rate announcement to gauge its impact on their purchasing power. The first interest rate reduction in four years is positive news, yet it must be balanced against ongoing supply issues and high home prices. Fillier emphasized that interest rate cuts alone cannot address the affordability crisis exacerbated by rising development fees in Ottawa—a move OREB opposes.

Sales Activity - YTD

Pricing Trends:

The MLS® Home Price Index (HPI) provides a more accurate reflection of price trends than average or median prices. In May 2024, the overall MLS® HPI composite benchmark price was $651,300, up 1.2% from May 2023. Single-family homes saw a benchmark price of $736,000, an increase of 1.1% year-over-year. Townhouse/row units had a benchmark price of $517,500, up 2.1%, while apartments had a benchmark price of $425,000, up 2.0%.

The average home price in May 2024 was $690,683, a 0.8% increase from May 2023. The year-to-date average price was $679,862, up 1.8% from the same period in 2023. The total dollar volume of home sales in May 2024 was $1.06 billion, down 8.5% from May 2023.

OREB advises caution when interpreting average sale prices, as they are based on total dollar volume and do not necessarily reflect individual property value changes. Prices can vary significantly across different neighbourhoods.

New Listings - YTD

Inventory Insights:

In May 2024, there were 3,034 new residential listings, a 26.2% increase from May 2023. New listings were 23.2% above the five-year average and 10.2% above the ten-year average for May. Active residential listings totaled 3,552 units at the end of May 2024, a 59.4% rise from May 2023. These active listings were 72.2% above the five-year average but 2.9% below the ten-year average for May.

The months of inventory, indicating the time it would take to sell current listings at the present sales rate, increased to 2.3 months in May 2024 from 1.3 months in May 2023.

Important to note is that these statistics can only be as accurate as there are condos sold in Ottawa. The more condos sold in an area, the more accurate the averages will be.

Want to chat about your options? Fill out the form at the bottom of the page, or text/call us directly at 613-900-5700 or fill out the form at the bottom of the page.

Do you have any questions about how this information affects your investment or looking for more information to make the best decision about your purchase? Let’s chat! Fill out the form on the bottom of the page.

Ottawa Condo Market Statistics - April 2024

Every month we take a closer look and drill down the sales data of Ottawa condos from the previous month. Here are the statistics for April 2024 in the top five "downtown" areas - Centretown, Byward Market and Sandy Hill, Little Italy (which includes Lebreton Flats), Hintonburg, and Westboro. The information will be specific to apartment-style condominiums, and only what is sold through the MLS. Also important to note that DOM (Day's On Market) is calculated to include the conditional period, which in Ottawa is roughly 14 days for almost every single transaction.


In April 2024, the Ottawa Real Estate Board (OREB) reported that 1,456 homes were sold through its MLS® System, marking an 8.9% increase compared to April 2023.

Although home sales for April were 2% below the five-year average and 6.9% below the 10-year average, the year-to-date figures showed promising growth. From January to April, there were 4,132 home sales, indicating an 11.5% increase over the same period in 2023.

OREB President, Curtis Fillier, remarked that the current market reflects a renewed confidence among both buyers and sellers. Sellers are more assured about listing their properties, encouraged by recent sales activity, while buyers are less pressured, allowing them to take their time in finding the right property. Fillier emphasized that while the market pace remains cautious due to economic factors, Ottawa's real estate market is robust and stable.

Delving deeper into the market trends, Fillier noted that townhomes are experiencing a shift towards a seller's market due to decreasing supply, while single-family homes dominate sales, leading to an increase in average sale prices. He anticipates that the coming months will offer valuable insights as buyers and sellers navigate post-pandemic adjustments amid upcoming events such as the federal election and government workers returning to offices.

The MLS® Home Price Index (HPI) provides a more accurate reflection of price trends compared to average or median price measures. In April 2024, the overall MLS® HPI composite benchmark price stood at $643,700, a marginal increase of 1.6% from April 2023. Single-family homes recorded a benchmark price of $727,700, up 1.6% year-over-year, while townhouses and apartments also saw modest gains.

The average price of homes sold in April 2024 was $705,117, representing a 1.2% increase from April 2023. Year-to-date, the average price reached $675,817, up by 2.4% compared to the first four months of 2023. The total dollar volume of home sales in April 2024 was $1.02 billion, marking a 10.2% increase from April 2023.

OREB cautioned that while the average sale price can indicate market trends over time, it should not be used to determine specific property values, as prices vary by neighborhood.

New listings surged by 40.5% in April 2024 compared to April 2023, with 2,597 new residential listings. Active residential listings also saw a substantial increase, reaching 2,966 units by the end of April 2024, up by 36.6% from April 2023. However, despite the rise in listings, the months of inventory only slightly increased from 1.6 to 2, indicating a balanced market condition.

In summary, the Ottawa real estate market continues to show resilience and growth, with both buyers and sellers navigating the evolving landscape with confidence.

Important to note is that these statistics can only be as accurate as there are condos sold in Ottawa. The more condos sold in an area, the more accurate the averages will be.

Want to chat about your options? Fill out the form at the bottom of the page, or text/call us directly at 613-900-5700 or fill out the form at the bottom of the page.

Do you have any questions about how this information affects your investment or looking for more information to make the best decision about your purchase? Let’s chat! Fill out the form on the bottom of the page.

Ottawa Condo Market Statistics - March 2024

Every month we take a closer look and drill down the sales data of Ottawa condos from the previous month. Here are the statistics for March 2024 in the top five "downtown" areas - Centretown, Byward Market and Sandy Hill, Little Italy (which includes Lebreton Flats), Hintonburg, and Westboro. The information will be specific to apartment-style condominiums, and only what is sold through the MLS. Also important to note that DOM (Day's On Market) is calculated to include the conditional period, which in Ottawa is roughly 14 days for almost every single transaction.


In March 2024, the Ottawa Real Estate Board recorded 1,165 homes sold via the MLS® System, marking a 10% increase over March 2023.

Home sales for the month were 21.5% below the five-year average and 15% below the 10-year average.

Year-to-date, home sales reached 2,678 units for the first three months of 2024, a 13.1% surge compared to the same period in 2023.

OREB President Curtis Fillier notes, "Ottawa's real estate landscape remains robust, setting the stage for an active spring and summer. Growing numbers of new listings and heightened showing activity indicate seller confidence is on the rise. However, buyers appear more hesitant, likely due to affordability concerns and limited supply."

Fillier observes a shifting dynamic in the market, fueled by post-pandemic adjustments in housing preferences. Some are downsizing or relocating from the outskirts, while others seek properties better suited to their evolving needs, creating pressure on the mid-range market. Fillier advises, "Engage promptly whether buying or selling, as the market dynamics are evolving swiftly."

The MLS® Home Price Index (HPI) provides a more precise gauge of price trends than average or median measures.

The composite benchmark price reached $636,700 in March 2024, up 2.7% from the previous year.

Single-family homes commanded a benchmark price of $719,000, reflecting a 2.6% increase year-over-year.

Townhouse/row units saw a modest uptick, with a benchmark price of $489,800, rising by 0.9% annually.

Benchmark apartment prices surged to $423,200, marking a 4.3% increase from the previous year.

The average home price in March 2024 stood at $682,078, marking a 5.1% increase from March 2023. The year-to-date average price was $659,828, up 3.2% from the first three months of 2023.

Total home sales volume in March 2024 reached $794.6 million, a 15.6% surge compared to the same month in 2023.

OREB emphasizes that while the average sale price provides insight into trends, it shouldn't be relied upon to assess individual property values, as prices vary across neighbourhoods.

March 2024 saw a 13.5% increase in new listings compared to March 2023, totaling 2,074 new residential listings. New listings trailed the five-year average by 2.3% and the 10-year average by 11.1%.

Active residential listings reached 2,543 units by the end of March 2024, marking an 18.3% increase from March 2023. Active listings surpassed the five-year average by 58.6% but fell short of the 10-year average by 17.7%.

With inventory at 2.2 months by the end of March 2024, slightly higher than March 2023's 2 months, but below the long-term average of 2.6 months, indicating a balanced market. Months of inventory represents the time it would take to deplete current inventory at the current sales rate.

Important to note is that these statistics can only be as accurate as there are condos sold in Ottawa. The more condos sold in an area, the more accurate the averages will be.

Want to chat about your options? Fill out the form at the bottom of the page, or text/call us directly at 613-900-5700 or fill out the form at the bottom of the page.

Do you have any questions about how this information affects your investment or looking for more information to make the best decision about your purchase? Let’s chat! Fill out the form on the bottom of the page.

Ottawa Condo Market Statistics - February 2024

Every month we take a closer look and drill down the sales data of Ottawa condos from the previous month. Here are the statistics for February 2024 in the top five "downtown" areas - Centretown, Byward Market and Sandy Hill, Little Italy (which includes Lebreton Flats), Hintonburg, and Westboro. The information will be specific to apartment-style condominiums, and only what is sold through the MLS. Also important to note that DOM (Day's On Market) is calculated to include the conditional period, which in Ottawa is roughly 14 days for almost every single transaction.


In February 2024, a total of 886 homes were sold through the MLS® System of the Ottawa Real Estate Board, marking a notable increase of 15.2% compared to the same period last year.

Despite this rise, home sales fell short of the five-year average by 13.8% and the 10-year average by 5.7% for the month of February. OREB President Curtis Fillier noted that while Ottawa's real estate market remains robust with rising metrics, affordability continues to be a concern, leaving many potential buyers and sellers sidelined.

MPAC recently highlighted a significant decrease in communities offering homes under $500,000, dropping from 74% a decade ago to just 19% today across Ontario.

Fillier emphasized the persistent demand for housing in Ottawa, attributing market activity constraints to a shortage of affordable and suitable housing options. OREB is advocating for impactful measures such as permitting four residential units on property lots and eliminating exclusionary zoning to address this issue.

Regarding prices, the MLS® Home Price Index (HPI) revealed that the overall benchmark price in February 2024 was $628,500, marking a 2.8% increase from the previous year. Single-family homes saw a benchmark price increase of 3.1% to $708,500, while townhouses/row units and apartments experienced more modest gains.

The average price of homes sold in February 2024 reached $651,340, up 2% from February 2023, with the total dollar volume of sales amounting to $577 million, a significant rise of 17.5% year-over-year.

OREB cautioned against relying solely on average sale prices to gauge individual property value fluctuations, emphasizing the variability of prices across different neighbourhoods over time.

In terms of inventory and new listings, February 2024 saw a notable 29.5% increase in new residential listings compared to the previous year, totalling 1,539. Active residential listings also rose by 16.3% to 2,158 units, with the months of inventory remaining steady at 2.4, indicating the time it would take to sell current inventories at the current rate of sales activity remained unchanged from February 2023.

Important to note is that these statistics can only be as accurate as there are condos sold in Ottawa. The more condos sold in an area, the more accurate the averages will be.

Want to chat about your options? Fill out the form at the bottom of the page, or text/call us directly at 613-900-5700 or fill out the form at the bottom of the page.

Do you have any questions about how this information affects your investment or looking for more information to make the best decision about your purchase? Let’s chat! Fill out the form on the bottom of the page.

Ottawa Condo Market Statistics - January 2024

Every month we take a closer look and drill down the sales data of Ottawa condos from the previous month. Here are the statistics for January 2024 in the top five "downtown" areas - Centretown, Byward Market and Sandy Hill, Little Italy (which includes Lebreton Flats), Hintonburg, and Westboro. The information will be specific to apartment-style condominiums, and only what is sold through the MLS. Also important to note that DOM (Day's On Market) is calculated to include the conditional period, which in Ottawa is roughly 14 days for almost every single transaction.


In January 2024, the Ottawa Real Estate Board (OREB) reported a total of 629 homes sold via the MLS® System, marking a 16.5% increase from the same period in 2023.

Despite this uptick, home sales were 10.7% below the five-year average and 3.9% below the ten-year average for January, reflecting a relatively subdued market, according to OREB President Curtis Fillier. He noted an increase in showing activity but cautioned that it hasn't fully translated into sales, suggesting that buyers are cautiously exploring options, unlike the pandemic era when swift decisions were often necessary.

OREB's policy and external relations manager, Brandon Reay, highlighted the persistent issue of low housing supply in Ottawa, stressing the need for more affordable housing options and increased density to meet population demands. He advocated for policy changes, including streamlining processes at the Ontario Land Tribunal, eliminating exclusionary zoning, and allowing four units on residential lots.

Regarding pricing trends, the MLS® Home Price Index (HPI) indicated a 3.2% year-over-year increase in the overall benchmark price to $621,600 in January 2024. Single-family homes saw a 3.7% increase to $703,500, while townhouses/row units experienced a 2.1% decrease to $462,200. The benchmark apartment price rose by 3.7% to $418,500.

In terms of average prices, homes sold for an average of $631,722 in January 2024, up 1.8% from the previous year. The total dollar volume of home sales also rose by 18.6% to $397.4 million compared to January 2023.

The number of new residential listings in January 2024 increased by 7.3% compared to the same month in 2023, totaling 1,271 listings. Active residential listings at the end of January 2024 numbered 1,961 units, up 4.5% from January 2023.

Inventory levels saw a slight decrease, with the months of inventory dropping to 3.1 in January 2024 from 3.5 in January 2023. Months of inventory represent the time it would take to sell the current inventory at the current sales rate.

Important to note is that these statistics can only be as accurate as there are condos sold in Ottawa. The more condos sold in an area, the more accurate the averages will be.

Want to chat about your options? Fill out the form at the bottom of the page, or text/call us directly 613-900-5700 or fill out the form at the bottom of the page.

Do you have any questions about how this information affects your investment or looking for more information to make the best decision about your purchase? Let’s chat! Fill out the form on the bottom of the page.

Ottawa Condo Market Statistics - December 2023

Every month we take a closer look and drill down the sales data of Ottawa condos from the previous month. Here are the statistics for December 2023 in the top five "downtown" areas - Centretown, Byward Market and Sandy Hill, Little Italy (which includes Lebreton Flats), Hintonburg, and Westboro. The information will be specific to apartment-style condominiums, and only what is sold through the MLS. Also important to note that DOM (Day's On Market) is calculated to include the conditional period, which in Ottawa is roughly 14 days for almost every single transaction.


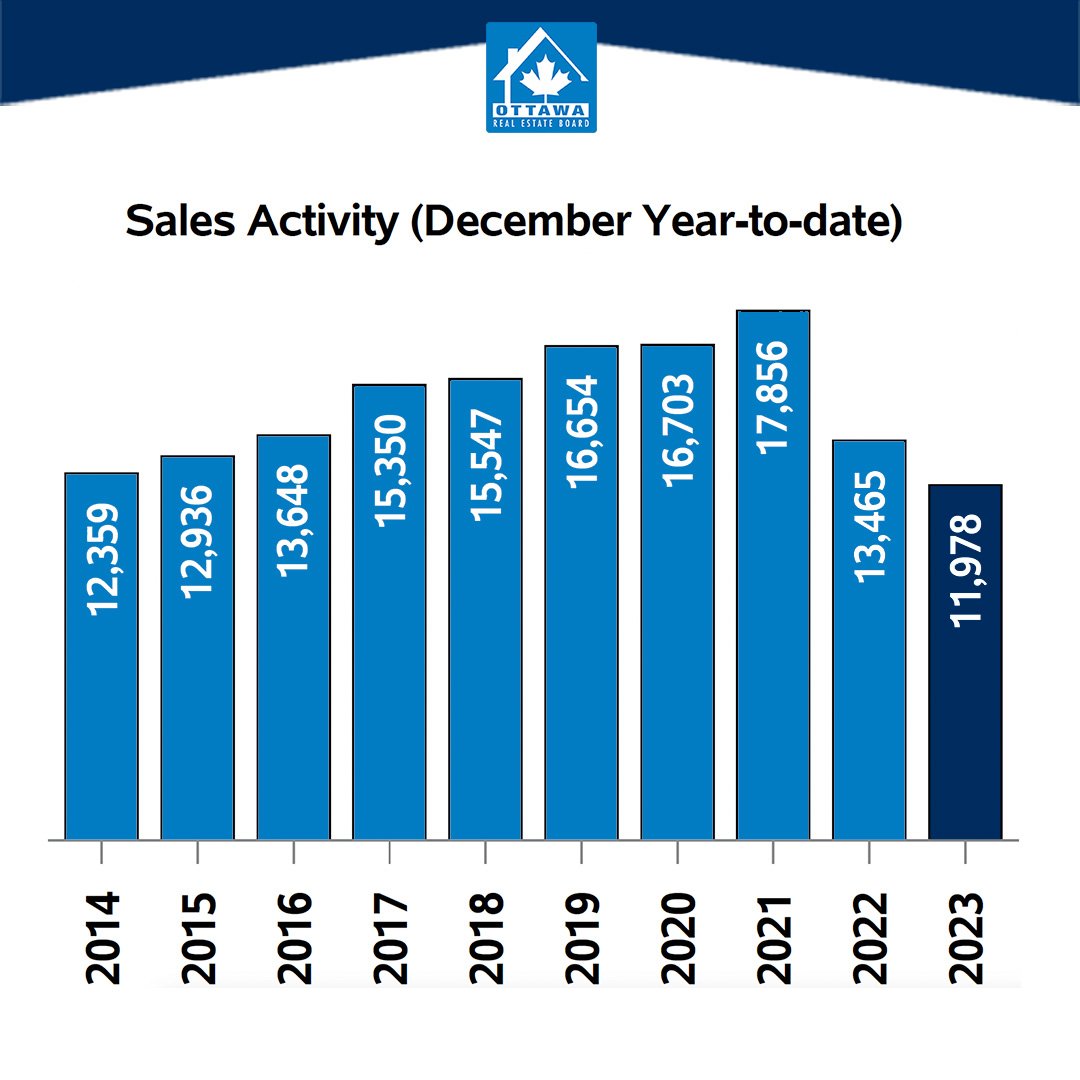
In December 2023, the Ottawa Real Estate Board reported a total of 565 homes sold through the MLS® System, marking a 7.6% rise from December 2022.

This figure stood 16% below the five-year average and 11.9% under the 10-year average for December.

For the entire 2023, there were 11,978 home sales, reflecting an 11.0% decrease from 2022.

OREB President Curtis Fillier commented, “Ottawa's housing market concluded 2023 in a poised, balanced position, hinting at a resurgence in consumer confidence. While the full effects of rate stabilization might unfold in the latter half of 2024, the momentum from December suggests a promising year for Ottawa.”

Ken Dekker, OREB's past president, added, “The market's path hasn't been straightforward. Although 2022’s peak might not be immediately revisited, Ottawa’s market seems set to reclaim lost territory. Both buyers and sellers should exercise patience; however, promising opportunities await.”

By the Numbers – Prices:

The MLS® Home Price Index (HPI) offers a more nuanced view of price trends than average or median prices. December 2023 witnessed a 2.7% uptick in the overall MLS® HPI composite benchmark price from the previous year, settling at $623,900.

Specifically:

  • Single-family homes: $704,900 (up 2.7% YoY)

  • Townhouse/row unit: $481,100 (a 4.2% YoY increase)

  • Apartments: $417,200 (a 2.1% YoY rise)

The average home price in December 2023 was $632,487, a 1.7% increment from December 2022. However, the average price for the year was $667,794, marking a 5.5% dip from 2022.

December 2023 recorded home sales worth $357.3 million, a 9.4% surge from December 2022. OREB emphasized that while the average sale price indicates overarching trends, it doesn't reflect specific property value changes.

By the Numbers – Inventory & New Listings:

New residential listings saw a notable drop, declining by 12.4% from December 2022 to 523 listings in December 2023. This figure was 4% shy of the five-year average and 16.1% less than the 10-year average for December.

By the end of December 2023, 1,844 residential listings were active, marking a 3.0% rise from December 2022. These active listings exceeded the five-year average by 55.5% but were 17.2% below the 10-year average.

The inventory measured at 3.3 months by December's end, slightly down from 3.4 months in December 2022. This metric gauges how long it would take to deplete the current inventory at the present sales rate.

Important to note is that these statistics can only be as accurate as there are condos sold in Ottawa. The more condos sold in an area, the more accurate the averages will be.

Want to chat about your options? Fill out the form at the bottom of the page, or text/call us directly 613-900-5700 or fill out the form at the bottom of the page.

Do you have any questions about how this information affects your investment or looking for more information to make the best decision about your purchase? Let’s chat! Fill out the form on the bottom of the page.

Ottawa Condo Market Statistics - November 2023

Every month we take a closer look and drill down the sales data of Ottawa condos from the previous month. Here are the statistics for November 2023 in the top five "downtown" areas - Centretown, Byward Market and Sandy Hill, Little Italy (which includes Lebreton Flats), Hintonburg, and Westboro. The information will be specific to apartment-style condominiums, and only what is sold through the MLS. Also important to note that DOM (Day's On Market) is calculated to include the conditional period, which in Ottawa is roughly 14 days for almost every single transaction.


In November 2023, a total of 724 homes were sold through the MLS® System of the Ottawa Real Estate Board, marking a slight decrease of 1.6% compared to November 2022. Home sales for the month were 31.8% below the five-year average and 27.4% below the 10-year average.

On a year-to-date basis, home sales amounted to 11,421 units after 11 months, indicating a significant decline of 11.7% compared to the same period in 2022.

OREB President Ken Dekker noted that sales are in line with expectations for the colder months. An increase in new and active listings is providing more choices in the market. Although this has slowed the pace of buying and selling, prospective buyers and those looking to upgrade can collaborate with their REALTOR® to carefully explore the market, identify ideal properties, and negotiate attractive deals at their own pace. Sellers, on the other hand, need to manage their expectations regarding the quantity of offers and transaction speed, relying on their REALTOR® for guidance on pricing and preparing their homes for a quality sale.

Turning to prices, the MLS® Home Price Index (HPI) serves as a more accurate measure of price trends than average or median price measures. The overall MLS® HPI composite benchmark price remained nearly unchanged at $628,900 in November 2023, reflecting a modest increase of 1.4% from November 2022. Single-family homes saw a benchmark price of $708,900, up 1.6% year-over-year, while townhouses and apartments had benchmark prices of $492,300 and $424,300, respectively.

The average price of homes sold in November 2023 was $633,138, a decrease of 0.8% from November 2022. The year-to-date average price was $669,536, representing a decline of 5.7% from the same period in 2022. The total dollar value of home sales in November 2023 was $458.4 million, down 2.4% from the same month in 2022.

OREB emphasizes that the average sale price can indicate trends over time but should not be relied upon to assess specific property values. Price variations exist between neighbourhoods.

In terms of inventory and new listings, there was a 2.7% increase in new listings in November 2023, totalling 1,428. This figure was 8.4% above the five-year average and 10.4% above the 10-year average for November. Active residential listings at the end of November numbered 2,752, showing a substantial gain of 15.8% from November 2022. Active listings were 53.9% above the five-year average and 6.7% below the 10-year average for November, reaching a level not seen in over five years.

The months of inventory stood at 3.8 at the end of November 2023, up from 3.2 in November 2022 and surpassing the long-run average of 3.3 months for this time of year. Months of inventory represent the number of months it would take to sell current inventories at the current rate of sales activity.

Important to note is that these statistics can only be as accurate as there are condos sold in Ottawa. The more condos sold in an area, the more accurate the averages will be.

Want to chat about your options? Fill out the form at the bottom of the page, or text/call us directly 613-900-5700 or fill out the form at the bottom of the page.

Do you have any questions about how this information affects your investment or looking for more information to make the best decision about your purchase? Let’s chat! Fill out the form on the bottom of the page.

Ottawa Condo Market Statistics - October 2023

Every month we take a closer look and drill down the sales data of Ottawa condos from the previous month. Here are the statistics for October 2023 in the top five "downtown" areas - Centretown, Byward Market and Sandy Hill, Little Italy (which includes Lebreton Flats), Hintonburg, and Westboro. The information will be specific to apartment-style condominiums, and only what is sold through the MLS. Also important to note that DOM (Day's On Market) is calculated to include the conditional period, which in Ottawa is roughly 14 days for almost every single transaction.


The Ottawa Real Estate Board totalled for a number of 816 units sold in October 2023. This was 2.7% less than in October 2022.

Home sales were 36.4% under the five-year average, and 30.8% under the 10-year average in the month of October.

Home sales totalled 10,700 units over the first 10 months of the year. This was a huge decline of 12.3 percent from the same period in 2022.

Ken Dekker, the President of OREB, suggests that the increasing cost of living may be causing both buyers and sellers to stay where they are. He notes a gradual decline in sales activity, which is expected for this time of year. Prices are also adjusting, with certain types of homes, such as apartments, experiencing higher sales compared to the previous October. Although Ottawa's inventory is slowly growing, persistent supply issues continue to create a lingering demand. Despite the current slowdown, Ken Dekker emphasizes that it's an opportune moment for buyers to act before the market shifts from a balanced state to one favouring sellers.

By the numbers: 

The MLS Home Price Index (HPI) tracks price trends by using average or median price measures.

  • The overall MLS HPI price for October 2023 remained relatively steady at 638,600, with a modest 1.8% increase compared to October 2022.

  • The price for single-family homes in September was 721,600, showing a 2.2% year-on-year increase.

  • For reference, the average price of a townhouse stood at 501,100, marking a slight 1% rise from the previous year.

  • The average price of apartments remained unchanged at 424,100 compared to a year ago.

  • In October 2023, the average price of homes sold reached 660,836, reflecting a 2.9% increase from October 2022. Meanwhile, the more comprehensive average price amounted to 671,983, indicating a 5.9% decrease in comparison to the first ten months of 2022.

  • The total value of all home sales in October 2023 was 539.2 million, which was identical to the figure for the same month last year.

Inventory and New Listings

  • In October 2023, the volume of new property listings increased by 6.6% compared to October 2022, reaching a total of 1,895 new residential listings. These new listings exceeded the five-year average by 2% and the 10-year average by 5.4% for the month of October.

  • By the end of October, there were 3,062 active residential listings on the market, marking a significant increase of 16.7% since October 2022. This level of active listings in October hasn't been seen in over five years. Active listings were 43.8% above the five-year average and 10.9% below the 10-year average for the month of October.

  • At the close of October 2023, there were 3.8 months of inventory, a slight increase from the 3.1 months recorded in October 2022. The months of inventory represent the estimated time it would take to sell the current inventory at the present rate of sales activity.

Important to note is that these statistics can only be as accurate as there are condos sold in Ottawa. The more condos sold in an area, the more accurate the averages will be.

Want to chat about your options? Fill out the form at the bottom of the page, or text/call us directly 613-900-5700 or fill out the form at the bottom of the page.

Do you have any questions about how this information affects your investment or looking for more information to make the best decision about your purchase? Let’s chat! Fill out the form on the bottom of the page.

Ottawa Condo Market Statistics - September 2023

Every month we take a closer look and drill down the sales data of Ottawa condos from the previous month. Here are the statistics for September 2023 in the top five "downtown" areas - Centretown, Byward Market and Sandy Hill, Little Italy (which includes Lebreton Flats), Hintonburg, and Westboro. The information will be specific to apartment-style condominiums, and only what sold through the MLS. Also important to note that DOM (Day's On Market) is calculated to include the conditional period, which in Ottawa is roughly 14 days for almost every single transaction.


In September 2023, the Ottawa Real Estate Board (OREB) reported a total of 946 homes sold through the MLS® System, marking no change from the same month in 2022.

The sales figures for September were notably 29.6% below the five-year average and 23.6% below the 10-year average. Looking at the year-to-date perspective, home sales amounted to 9,889 units over the first nine months, indicating a significant 13% decrease compared to the same period in 2022.

OREB President Ken Dekker commented, "Sales activity remains consistent with last year but falls below the usual levels for September. A surge in new listings over the past few months has led to a gradual increase in overall inventories. Despite this, the available supply remains historically low, with room for absorbing additional listings. Our market is currently in a balanced state, and while MLS® Benchmark prices have decreased from last year, they are trending at levels similar to 2021."

Turning our attention to pricing trends, the MLS® Home Price Index (HPI) is highlighted as a more accurate measure compared to average or median price calculations. In September 2023, the overall MLS® HPI composite benchmark price stood at $643,600, showing a marginal increase of 0.5% from the same month in 2022. The benchmark prices for single-family homes and townhouse/row units saw slight changes, while the benchmark apartment price experienced a modest decline.

The average price of homes sold in September 2023 was $675,412, reflecting a 2.7% increase from September 2022. However, the year-to-date average price of $672,837 indicated a decline of 6.5% from the first nine months of 2022.

The total dollar value of home sales in September 2023 reached $638.9 million, a modest 2.7% increase from the same month in 2022. OREB emphasizes that while the average sale price is useful for establishing trends, it should not be considered an indicator of specific property value changes, as prices vary by neighborhood.

Looking at new listings, there was a 9.8% increase from September 2022, with 2,259 new residential listings in September 2023. Active residential listings at the end of September 2023 totaled 2,997 units, marking a substantial 14% increase from the end of September 2022 and reaching a five-year high for the month of September.

The months of inventory, indicating the time it would take to sell current inventories at the current sales rate, numbered 3.2 at the end of September 2023. While this was an increase from the 2.8 months recorded in September 2022, it remained below the long-run average of 3.3 months for this time of year.

Important to note is that these statistics can only be as accurate as there are condos sold in Ottawa. The more condos sold in an area, the more accurate the averages will be.

Want to chat about your options? Fill out the form at the bottom of the page, or text/call us directly 613-900-5700 or fill out the form at the bottom of the page.

Do you have any questions about how this information affects your investment or looking for more information to make the best decision about your purchase? Let’s chat! Fill out the form on the bottom of the page.

Ottawa Condo Market Statistics - August 2023

Every month we take a closer look and drill down the sales data of Ottawa condos from the previous month. Here are the statistics for August 2023 in the top five "downtown" areas - Centretown, Byward Market and Sandy Hill, Little Italy (which includes Lebreton Flats), Hintonburg, and Westboro. The information will be specific to apartment-style condominiums, and only what sold through the MLS. Also important to note that DOM (Day's On Market) is calculated to include the conditional period, which in Ottawa is roughly 14 days for almost every single transaction.


In the month of August, OREB members sold 1196 residential properties - up 6% over last year. This is broken down into 903 freeholds (up 7% from the same period last year) and 293 condos (up 2% from the same period last year). However, these numbers are lower than the five-year average for August. 

OREB President Ken Dekker explains that sales in August hve increased year over year but still remain below historical averages. This can be attributed to strong demand entering the market through our growing population, contrasted by the lack of suitable or affordable housing options and high borrowing costs.

Key figures include:

Average Prices:

  • The average sale price for freehold-class properties in August was $709,739, a 0.5% increase from 2022 but a 5.6% decrease compared to July 2023.

  • Condominium-class properties had an average sale price of $425,968, a 1% increase from the previous year but 1.4% lower than July 2023.

Year-to-date average sale prices are $732,220 for freeholds (an 8% decrease from 2022) and $432,571 for condos (a 5.5% decrease from 2022).

Inventory & New Listings:

  • August's new listings totalled 2,228, a 7% increase from August 2022, and were on par with the previous month (2,234). The 5-year average for new listings in August is 2,177.

  • Months of Inventory for freehold-class properties increased to 3 months from 2.9 months in August 2022 and 2.7 months in July 2023.

  • Months of Inventory for condominium-class properties remained similar to August 2022 at 2.2 months, slightly decreasing from 2.3 months in July 2023.

  • Days on market (DOM) for freeholds increased to 31 days from 25 days in August 2022 and 26 days in July 2023.

  • DOM for condos increased to 29 days from 28 days in August 2022 and 28 days in July 2023.

Additionally, OREB Members have played a crucial role in assisting clients with rentals, facilitating the renting of 4,571 properties since the beginning of the year, marking a 10% increase compared to the same period last year when 4,172 properties were rented.

Important to note is that these statistics can only be as accurate as there are condos sold in Ottawa. The more condos sold in an area, the more accurate the averages will be.

Want to chat about your options? Fill out the form at the bottom of the page, or text/call us directly 613-900-5700 or fill out the form at the bottom of the page.

Do you have any questions about how this information affects your investment or looking for more information to make the best decision about your purchase? Let’s chat! Fill out the form on the bottom of the page.

Ottawa Condo Market Statistics - July 2023

Every month we take a closer look and drill down the sales data of Ottawa condos from the previous month. Here are the statistics for July 2023 in the top five "downtown" areas - Centretown, Byward Market and Sandy Hill, Little Italy (which includes Lebreton Flats), Hintonburg, and Westboro. The information will be specific to apartment-style condominiums, and only what sold through the MLS. Also important to note that DOM (Day's On Market) is calculated to include the conditional period, which in Ottawa is roughly 14 days for almost every single transaction.


In July, the Ottawa Real Estate Board (OREB) had an impressive month, with its members selling 1,263 residential properties through the Multiple Listing Service® (MLS®) System. This represents a significant 15% increase compared to the same month last year (2022), when 1,102 properties were sold.

Breaking down the sales, the freehold-property class saw a substantial jump, with 979 houses sold, marking an impressive 18% increase from the same period a year ago. Additionally, the condominium-property category also showed healthy growth, with 284 units sold, reflecting a 6% increase from July 2022.

Notably, both freehold and condominium properties had higher average prices. The average sale price for a freehold-class property in July was $754,188, which is 5% higher than prices seen in 2022, and there was a modest 1% increase compared to June 2023. The average sale price for a condominium-class property reached $435,094, indicating a 2% rise compared to the same period last year, though it was 3% lower than prices recorded in June 2023.

Despite the two recent quarter-percent interest rate hikes by the Bank of Canada, Ottawa's real estate market remains resilient, and consumers show confidence in its stability and growth potential.

July's figures, both in sales and average prices, are positive indicators that gradually close the gap from the peak pandemic market activity observed in early 2022. Furthermore, inventory levels continue to increase, with new listings added to the housing stock, providing more choices for prospective homebuyers.

While the market currently favours sellers, it's important to maintain a realistic perspective. Not every property will attract multiple offers or sell quickly. A property's price is ultimately determined by the willingness of buyers to pay, and working with a professional licensed REALTOR® becomes crucial in navigating this dynamic market landscape.

Looking ahead, there are promising signs for continued growth in the real estate sector. The second half of the year is likely to yield solid year-over-year results, given the positive indicators observed in July.

On the rental side, OREB members have been actively assisting clients, facilitating the renting of 3,921 properties since the beginning of the year. This figure marks an 11% increase from the same period last year (2022), showing continued demand for rental properties in the region.

Important to note is that these statistics can only be as accurate as there are condos sold in Ottawa. The more condos sold in an area, the more accurate the averages will be.

Want to chat about your options? Fill out the form at the bottom of the page, or text/call us directly 613-900-5700 or fill out the form at the bottom of the page.

Do you have any questions about how this information affects your investment or looking for more information to make the best decision about your purchase? Let’s chat! Fill out the form on the bottom of the page.
Ottawa Condo Market Statistics - June 2023

Every month we take a closer look and drill down the sales data of Ottawa condos from the previous month. Here are the statistics for June 2023 in the top five "downtown" areas - Centretown, Byward Market and Sandy Hill, Little Italy (which includes Lebreton Flats), Hintonburg, and Westboro. The information will be specific to apartment-style condominiums, and only what sold through the MLS. Also important to note that DOM (Day's On Market) is calculated to include the conditional period, which in Ottawa is roughly 14 days for almost every single transaction.


In June, Ottawa Real Estate Board (OREB) members sold 1,658 residential properties through the Board's MLS® System, marking an 11% increase from June 2022’s 1,493 sold properties. Within this, 1,234 were freehold, a 10% increase from last year, and 424 condominium properties were sold, a 16% increase from June 2022. The five-year average for total unit sales in June is 1,881.

OREB President Ken Dekker stated that while June's sales exceeded last year's, the number of sales, average prices, and new listings declined on a week-to-week basis throughout the month. The summer decline in activity combined with the Bank of Canada's interest rate adjustment at the beginning of the month may have contributed to this trend.

The average sale price for a freehold property in June was $746,445, showing a 4% decrease from 2022 but remaining consistent with May 2023 prices. The average sale price for a condominium property was $448,380, a 2% increase from the previous year and a 1% increase from May 2023 prices. Year-to-date average sale prices for freehold properties are $731,847, reflecting a 10% decrease from 2022, while average sale prices for condominiums are $432,885, indicating a 7% decrease from the previous year.

Dekker expressed optimism about the increase in inventory, which suggests sellers have confidence in the market. This growing resale housing stock is expected to provide more options for buyers and contribute to increased sales.

In terms of inventory and new listings, June's new listings amounted to 2,758, which is 14% lower than June 2022 and 2% lower than May 2023. The five-year average for new listings in June is 2,802. Months of inventory for freehold properties increased to 2.1 months from 1.9 months in June 2022 and 1.5 months in May 2023. For condominium properties, months of inventory decreased to 1.4 months from 1.6 months in June 2022 but increased compared to 1.3 months in May 2023. The days on market (DOM) for freehold properties remained at 23 days, while for condos, it increased to 27 days from the previous month's 26 days.

Dekker anticipates a strong second half of 2023 in terms of sales volume and prices compared to last year.

OREB Members have also assisted clients in renting properties, with 3,336 rentals facilitated since the beginning of the year, marking a 14% increase from the same period last year when 2,919 rentals were arranged.

Important to note is that these statistics can only be as accurate as there are condos sold in Ottawa. The more condos sold in an area, the more accurate the averages will be.

Want to chat about your options? Fill out the form at the bottom of the page, or text/call us directly 613-900-5700 or fill out the form at the bottom of the page.

Do you have any questions about how this information affects your investment or looking for more information to make the best decision about your purchase? Let’s chat! Fill out the form on the bottom of the page.

Ottawa Condo Market Statistics - May 2023

Every month we take a closer look and drill down the sales data of Ottawa condos from the previous month. Here are the statistics for May 2023 in the top five "downtown" areas - Centretown, Byward Market and Sandy Hill, Little Italy (which includes Lebreton Flats), Hintonburg, and Westboro. The information will be specific to apartment-style condominiums, and only what sold through the MLS. Also important to note that DOM (Day's On Market) is calculated to include the conditional period, which in Ottawa is roughly 14 days for almost every single transaction.


Members of the Ottawa Real Estate Board sold 1939 properties in May, an increase of 6% from May of 2022! This includes 1477 freehold properties (up 8%) and 462 condos (up 1%). This is also just below the five-year average for May, which is 1961. 

Ken Dekker, Ottawa Real Estate Board President, explains that May is typically the highest-selling month. He explains that this is the first volume increase in year-over-year sales since February 2022. It shows a lot of promise for sellers who were struggling with finding buyers during the interest rate increases. 

Dekker explains that we are only seeing around 5-6 weeks of inventory, so our market is leaning heavily toward the seller side. 

Average prices are decreasing year-over-year, but staying relatively similar to previous months. Freehold properties saw an average price of $745,902, which is a 7% decrease from last year, but the same as last month. Condominium class properties averaged at $442,859, a 6% decrease from last year but a 2% increase from last month. Year to date, freehold properties have seen a 12% decrease in price compared to 2022, and condominiums a 9% decrease from 2022.

Dekker continues to explain that we are not seeing any steep price escalations, and that May’s prices are still on par with April. With higher demand and low inventory, Dekker believes prices will continue to rise as long as interest rates remain the same or begin to drop. 

May saw 2822 listings, which is down 9% from May 2022’s 3117 new listings, but up from last month’s 2140 new listings. This is also only slightly lower than the 5-year average for May listings, which is 2922. 

Freehold inventory for this month has increased to 1.5 months over 1.2 months in May of 2022 but is down from the 1.9 months available in April. Condominium inventory has increased from 1 month in May 2022 to 1.3 months in May 2023 but is down from 1.9 months last month. Days on market for freeholds has dropped from 27 to 23 days. And for condos, from 33 to 26 over the last month. 

Dekker explains that due to low inventory, multiple offer scenarios are happening more often, and that a well-equipped real estate agent will be able to help buyers and sellers navigate this new market. 

Finally, OREB members helped 2731 clients find rentals in May, up 22% from the 2230 people assisted in May of 2022.

Important to note is that these statistics can only be as accurate as there are condos sold in Ottawa. The more condos sold in an area, the more accurate the averages will be.

Want to chat about your options? Fill out the form at the bottom of the page, or text/call us directly 613-900-5700 or fill out the form at the bottom of the page.

Do you have any questions about how this information affects your investment or looking for more information to make the best decision about your purchase? Let’s chat! Fill out the form on the bottom of the page.

Ottawa Condo Market Statistics - April 2023

Every month we take a closer look and drill down the sales data of Ottawa condos from the previous month. Here are the statistics for April 2023 in the top five "downtown" areas - Centretown, Byward Market and Sandy Hill, Little Italy (which includes Lebreton Flats), Hintonburg, and Westboro. The information will be specific to apartment-style condominiums, and only what sold through the MLS. Also important to note that DOM (Day's On Market) is calculated to include the conditional period, which in Ottawa is roughly 14 days for almost every single transaction.


In April, the Ottawa Real Estate Board saw 1488 residential properties sold through MLS. This is down 21% from April 2022, where we saw 1876 sales. This month’s sales included 1156 freehold homes (down 18%) and 332 condominium units (down 29%). This month’s total sales is also significantly lower than the 5-year average for April, which is 1739 sales.

Despite historically low numbers, Ken Dekker, President of the Ottawa Real Estate Board, explains that we are still seeing Ottawa’s resale market on an upward trend. We’re seeing numbers closer to what we were seeing during peak pandemic activity in 2022, which is encouraging. However, he also states that new listings are not keeping up to this activity, so inventory is declining quickly, meaning we’re headed back into a seller’s market. 

Average prices in Ottawa have increased over the last few months by 13.9%. In freehold properties, average prices are down 10% year over year, but still up 5% over the previous month. Condominiums are also down year over year by 8%, but are up 4% from last month. 

Dekker explains that pressure on sales prices has continued - average prices have increased each month of this year, and we’re seeing more and more multiple offer situations and less days on market. Low inventory is affecting supply, and the pressure on buyers is coming back.

In April, the city saw 2144 new listings, 25% down from the 2943 in 2022. This is slowly catching up to the 5 year average for new listings in April, which is 2575. Freehold property inventory has increased from April 2022 where it was 0.9 months to 1.9 months, but this is down from March’s 2.3 months of inventory. In condominiums, we also have 1.9 months of inventory, up from 0.8 in APril of 2022 but down from 2.1 months in March of 2023. Days on market is down from 34 to 37 in freeholds and from 39 to 33 for condominiums. 

In the world of rentals, OREB members helped 2152 rental clients find their new home, up 20% from 1786 this time last year. 

Important to note is that these statistics can only be as accurate as there are condos sold in Ottawa. The more condos sold in an area, the more accurate the averages will be.

Want to chat about your options? Fill out the form at the bottom of the page, or text/call us directly 613-900-5700 or fill out the form at the bottom of the page.

Do you have any questions about how this information affects your investment or looking for more information to make the best decision about your purchase? Let’s chat! Fill out the form on the bottom of the page.