Why Invest in Condos in Ottawa? The Benefit of a Booming Condo Market

The capital city of Canada is home to a booming real estate market - with a steadily increasing population and a high demand for housing. Despite the recent dip in the market, Ottawa remains a seller’s market with a high level of interest and a low level of inventory.

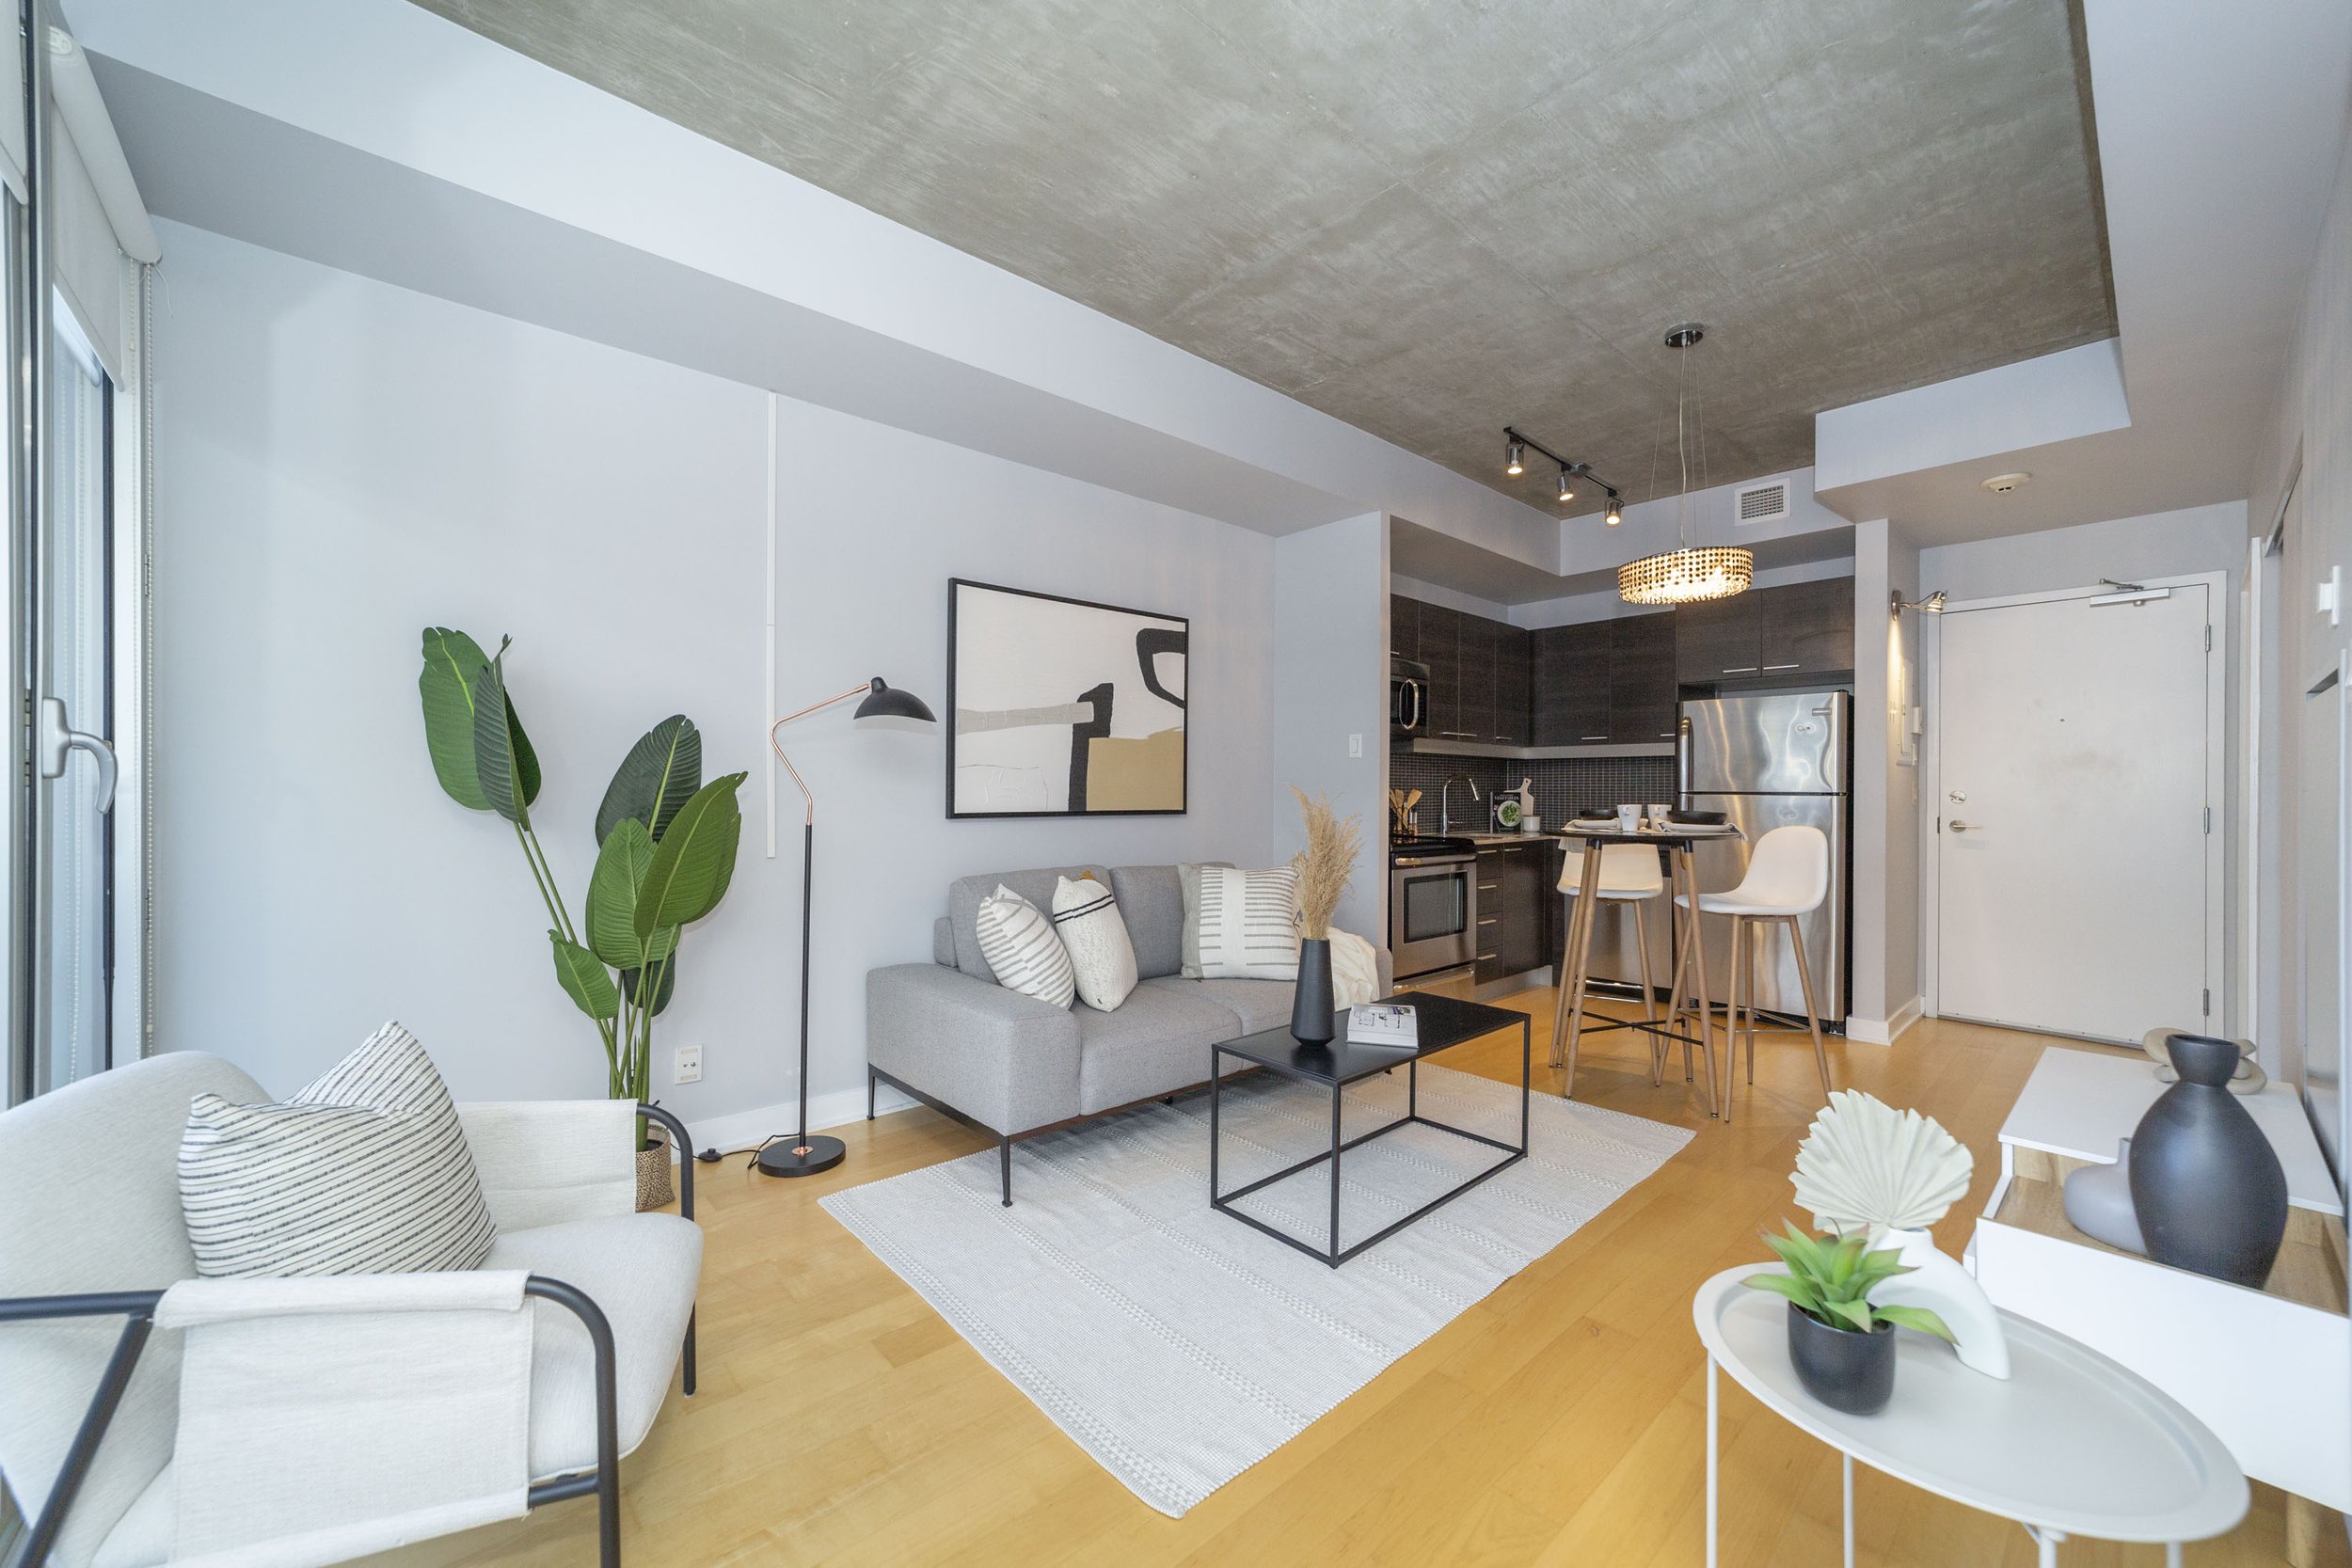
Ottawa is also a condo-centred city, with tons of options for all lifestyles and budgets. Condos continue to pop up in the city every day, with new projects continually proposed. The demand for easy, downtown living is clearly high here and continues to grow with the population.

Economic Growth

Ottawa has a stable economy and a low unemployment rate, which is always good news for real estate investors. Ottawa has a very diverse economy, with plenty of large sectors in the area including government, tech, healthcare, and education. This stability has contributed to a steady increase in property values and eligible tenants.
High Demand

Ottawa’s population has been steadily increasing over the years, and will continue to do so as Canada and Ontario particularly continue to welcome more people. Condos in particular have become more popular in Ottawa because of their affordability and convenience. Many people in the city are looking for small and affordable living spaces. Furthermore, homes that are close to the action of downtown - whether that be work or shopping, dining, and entertainment. They also fix a lot of the problems that come from Ottawa’s harsh winters. In condos, snow removal is covered by the building, parking is typically inside, and there are often amenity spaces to host friends outside of your home without having to travel.

Rental Market

Another reason Ottawa is a great place for investing in condos is that Ottawa is a major rental city. From a high student and young-professional population, there are plenty of renters in the city who are looking for small, affordable, and temporary properties in the area. Condos, additionally, are an excellent choice for investors anywhere because they offer low-maintenance, turn-key investments that typically bring in more income than residential rentals.

Amenities and Lifestyle

Ottawa is a great city for condo investments too because of the amenities and lifestyle that are offered in so many of these buildings. Condos not only reduce a lot of the maintenance and housework that can be a deterrent for renters (like shovelling snow, parking outside, gardening, and more), but they also offer a lot of great options to replace what a condo unit may lack compared to a residential home. Condos often have party rooms, pools and hot tubs, and gyms - meaning residents don’t have to leave the comfort of their homes to host parties, swim or relax, or workout. All of these lifestyle additions are a huge attraction for tenants.

Ottawa Condo Market Statistics - April 2023

Every month we take a closer look and drill down the sales data of Ottawa condos from the previous month. Here are the statistics for April 2023 in the top five "downtown" areas - Centretown, Byward Market and Sandy Hill, Little Italy (which includes Lebreton Flats), Hintonburg, and Westboro. The information will be specific to apartment-style condominiums, and only what sold through the MLS. Also important to note that DOM (Day's On Market) is calculated to include the conditional period, which in Ottawa is roughly 14 days for almost every single transaction.


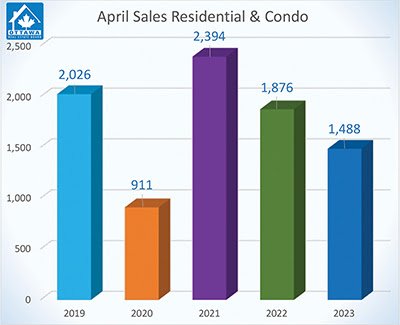
In April, the Ottawa Real Estate Board saw 1488 residential properties sold through MLS. This is down 21% from April 2022, where we saw 1876 sales. This month’s sales included 1156 freehold homes (down 18%) and 332 condominium units (down 29%). This month’s total sales is also significantly lower than the 5-year average for April, which is 1739 sales.

Despite historically low numbers, Ken Dekker, President of the Ottawa Real Estate Board, explains that we are still seeing Ottawa’s resale market on an upward trend. We’re seeing numbers closer to what we were seeing during peak pandemic activity in 2022, which is encouraging. However, he also states that new listings are not keeping up to this activity, so inventory is declining quickly, meaning we’re headed back into a seller’s market. 

Average prices in Ottawa have increased over the last few months by 13.9%. In freehold properties, average prices are down 10% year over year, but still up 5% over the previous month. Condominiums are also down year over year by 8%, but are up 4% from last month. 

Dekker explains that pressure on sales prices has continued - average prices have increased each month of this year, and we’re seeing more and more multiple offer situations and less days on market. Low inventory is affecting supply, and the pressure on buyers is coming back.

In April, the city saw 2144 new listings, 25% down from the 2943 in 2022. This is slowly catching up to the 5 year average for new listings in April, which is 2575. Freehold property inventory has increased from April 2022 where it was 0.9 months to 1.9 months, but this is down from March’s 2.3 months of inventory. In condominiums, we also have 1.9 months of inventory, up from 0.8 in APril of 2022 but down from 2.1 months in March of 2023. Days on market is down from 34 to 37 in freeholds and from 39 to 33 for condominiums. 

In the world of rentals, OREB members helped 2152 rental clients find their new home, up 20% from 1786 this time last year. 

Important to note is that these statistics can only be as accurate as there are condos sold in Ottawa. The more condos sold in an area, the more accurate the averages will be.

Want to chat about your options? Fill out the form at the bottom of the page, or text/call us directly 613-900-5700 or fill out the form at the bottom of the page.

Do you have any questions about how this information affects your investment or looking for more information to make the best decision about your purchase? Let’s chat! Fill out the form on the bottom of the page.

Ottawa Condo Market Statistics - March 2023

Every month we take a closer look and drill down the sales data of Ottawa condos from the previous month. Here are the statistics for March 2023 in the top five "downtown" areas - Centretown, Byward Market and Sandy Hill, Little Italy (which includes Lebreton Flats), Hintonburg, and Westboro. The information will be specific to apartment-style condominiums, and only what sold through the MLS. Also important to note that DOM (Day's On Market) is calculated to include the conditional period, which in Ottawa is roughly 14 days for almost every single transaction.


In the month of March, Ottawa Real Estate Board members sold 1194 residential properties, compared to 2003 in March of 2022. This includes 893 freehold properties, down 40% from the previous year, and 301 condominium properties, down 42% from the previous year.

This is still a rise in transactions month over month and shows that the market is picking up for the spring.

The average price for freehold properties in March was $710,070, down 17% from March of 2022. However, this is a slight increase from February 2023, showing that the market is beginning to pick up again. Freehold prices have, since December of 2022, climbed around 8%!

Condominiums were selling for an average of $418,670, down 13% from this time last year, but up 2% over last month.

Year to date freehold sale prices are at $701,837 and $414,698 for condominiums.

The recent month-over-month climb in prices in 2023 has illustrated that the market is stabilizing along with interest rates.

Inventory is also increasing. Freehold properties have seen an increase from 0.6 months in March 2022 to 2.3 months in March 2023. Condominiums have sen an increase from 0.6 months to 2.8 months year over year.

Days on market in Ottawa for this month has also decreased - from 37 to 34 for freehold homes and from 43 to 39 for condominiums.

Ken Dekker explains that well priced homes are selling. Real estate agents must have recent statistics to ensure sellers are prepared to position themselves effectively within the market. Buyers can benefit from the same information to negotiate with sellers.

OREB members also assisted with renting 1599 properties this March, increasing 24% from the previous year.

Important to note is that these statistics can only be as accurate as there are condos sold in Ottawa. The more condos sold in an area, the more accurate the averages will be.

Want to chat about your options? Fill out the form at the bottom of the page, or text/call us directly 613-900-5700 or fill out the form at the bottom of the page.

Do you have any questions about how this information affects your investment or looking for more information to make the best decision about your purchase? Let’s chat! Fill out the form on the bottom of the page.

Ottawa Condo Market Statistics - February 2023

Every month we take a closer look and drill down the sales data of Ottawa condos from the previous month. Here are the statistics for February 2023 in the top five "downtown" areas - Centretown, Byward Market and Sandy Hill, Little Italy (which includes Lebreton Flats), Hintonburg, and Westboro. The information will be specific to apartment-style condominiums, and only what sold through the MLS. Also important to note that DOM (Day's On Market) is calculated to include the conditional period, which in Ottawa is roughly 14 days for almost every single transaction.


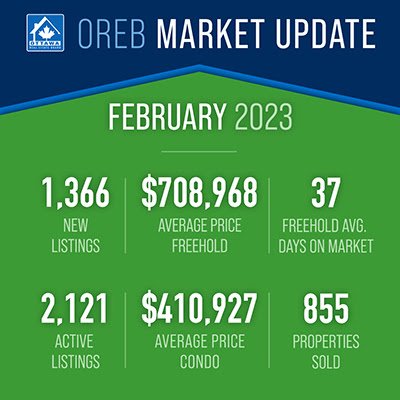
In the month of February, Ottawa Real Estate Board members sold 855 residential properties through MLS. This is down 39% from last year’s 1411 sales. This includes 633 freehold-class properties (down 42% year over year), and 222 condominium-class properties (down 31%). This is also down from the five year average for total sales in the month of February, which is 1157.

Average sale prices are still down year over year. Freehold properties are seeing an average price of $708,968 which is a decrease of 15% from February 2022. However, this is an increase of 5% compared to January 2023, which is a promising trend.

Condominium prices averaged $410,927, which is a decrease of 12% from February last year.

Year-to-date averages also show a decrease - of 14% for freeholds and 10% for condominiums.

Ken Dekker, OREB President, explains that “the average price increase” indicates that buyers have gotten used to the current interest rates, which is a sign of hope for the future!

Inventory in the city has increased. Year over year, we’ve seen huge increases in properties on the market in both freehold and condominium-class properties.

Freehold properties increased from 0.7 months of inventory to 2.8 months. Condominium inventory increased from 0.7 months to 2.5 months.

February’s new listings for 2023 were 22% lower than February 2022, but were up 3% from January 2023. Compared to the 5 year average of 1632 new listings, this February we saw 1366.

Days on market decreased from 43 to 37 days for freeholds and 47 to 43 for condominiums compared to last month as well.

A decrease in days on market, says Dekker, paired with fewer new listings coming on the market, is great news for sellers. It’s unclear now if those trends will take us back to a seller’s market from the balanced market we are currently in, but we’ll begin to see in the next few months.

Since the beginning of the year, OREB Members have assisted clients with renting 995 properties compared to 800 last year at this time, an increase of 24%.

Important to note is that these statistics can only be as accurate as there are condos sold in Ottawa. The more condos sold in an area, the more accurate the averages will be.

Want to chat about your options? Fill out the form at the bottom of the page, or text/call us directly 613-900-5700 or fill out the form at the bottom of the page.

Do you have any questions about how this information affects your investment or looking for more information to make the best decision about your purchase? Let’s chat! Fill out the form on the bottom of the page.

Ottawa Condo Market Statistics - January 2023

Every month we take a closer look and drill down the sales data of Ottawa condos from the previous month. Here are the statistics for January 2022 in the top five "downtown" areas - Centretown, Byward Market and Sandy Hill, Little Italy (which includes Lebreton Flats), Hintonburg, and Westboro. The information will be specific to apartment-style condominiums, and only what sold through the MLS. Also important to note that DOM (Day's On Market) is calculated to include the conditional period, which in Ottawa is roughly 14 days for almost every single transaction.


In the month of January, OREB members sold 606 residential properties. This is down 35% from last January, when we sold 933. This includes 460 residential class properties and 146 condominiums, down 30% and 47% respectively. This is also significantly lower than the 5-year average of 819 sales. 

The new OREB President, Ken Dekker, explains that the slowdown indicates potential home buyers are taking their time. He states he believes they are being cautious during uncertain conditions. 

In terms of prices: Condo properties saw a decrease of 8% for an average of $412,244. Freehold properties saw a decrease of 12% from last January, with an average price of $676,272. However, Dekker explains this isn’t a crashing market, but instead a market that is just balancing out after the extreme prices and low rates during COVID. It is ‘levelling out’. 

It’s also a good sign that prices are actually increasing from December! Up 3% month over month. Condo prices have dropped in comparison, around 5%, but those numbers are actually more volatile due to fewer condos being sold than freehold properties. 

Inventory has also increased! Freehold properties are now up to 3.8 months rather than 0.9 months last January. Condos are also up to 3.8 months of inventory instead of 0.8 last January. New listings this month are sitting at 1324, 16% higher than 1142 in January 2022, and are up 899 from December 2022 when there were only 699 listings. This is also higher than the 5-year average for January, which was 1233. 

Dekker explains that these figures are typical for a balanced market, a sign that buyers aren’t “racing to put in an offer.” New listings and supply illustrate to buyers that they can take time selecting a home and put in the conditions that they want in their offers. 

More people are also turning to real estate agents for help with rentals, up 24% from 410 last year to 509 this year. 

Important to note is that these statistics can only be as accurate as there are condos sold in Ottawa. The more condos sold in an area, the more accurate the averages will be.

Want to chat about your options? Fill out the form at the bottom of the page, or text/call us directly 613-900-5700 or fill out the form at the bottom of the page.

Do you have any questions about how this information affects your investment or looking for more information to make the best decision about your purchase? Let’s chat! Fill out the form on the bottom of the page.

2022 Condo Market Recap with Mitch MacKenzie

The change in the condo market from 2021 to 2022 is a nuanced one. We started the year with an exceptionally fast paced market, and ended with a more slow, balanced one. Mitch MacKenzie has taken the time to pull statistics from the past two years in the Ottawa condo market to give us a better understanding of how trends are looking into 2023. 

Here is the area of Ottawa we are working with for these statistics. 

In 2021, there were 983 condo sales in the city limits. In 2022, we saw a drop of only 6 units, for a total of 977 condo sales throughout the year. 

The average price of condos in the city actually rose considerably, up $23,465 from 2021. The median price rose even higher, $28,500 more than 2021. 

Below is a breakdown of the prices we saw in studio, 1 bed, and 2 bedroom condos within the city limits this year and last, to show where the increases are most prevalent, and which months we saw large increases. 

So now, let’s look into the two halves of the year. As mentioned earlier, 2022 was categorized by two distinct half-years with very different market conditions. 

In the first half of the year, there were twice as many houses sold as there were in the second!

It does seem like the market is slowing down considerably, but for the time being, demand is still high! Mitch breaks down what a buyer’s and seller’s market means - and due to our inventory being 1.86 months as of the start of 2023, we’re still in a seller’s market! This means there are considerably more buyers at the moment than there are sellers. 

Now, let’s take a look at the days on market for each quarter of the past two years. We’re seeing that the 2021 average was actually higher every quarter, except for the fourth quarter, where the days on market averaged out the same. 

Mitch explains that although lending has been tightening over the last year, this has actually impacted the residential market a lot more than the condo market, as more residential buyers have been forced down to condos and less condo buyers can move up into residential.

Mitch MacKenzie

New Purveyors’ resident condo expert.

mitch@newpurveyors.com

Ottawa Condo Market Statistics - December 2022

Every month we take a closer look and drill down the sales data of Ottawa condos from the previous month. Here are the statistics for December 2022 in the top five "downtown" areas - Centretown, Byward Market and Sandy Hill, Little Italy (which includes Lebreton Flats), Hintonburg, and Westboro. The information will be specific to apartment-style condominiums, and only what sold through the MLS. Also important to note that DOM (Day's On Market) is calculated to include the conditional period, which in Ottawa is roughly 14 days for almost every single transaction.


In December, members of the Ottawa Real Estate Board sold 601 properties. This is a 30% decrease from December 2021, where the board sold 857 properties. 466 of these sales were in the residential property class, which is a 22% decrease. 135 of these properties were in the condominium property class, down 48%. 601 sales is also significantly lower than the 5 year average for the month of December, which is 775. 

Year in Review

Sales in 2022 are down in total sales as well as sales volume. In 2022, members of the Ottawa Real Estate board sold a total of 15,288 homes - residential and condo. This is down 25% from total sales in 2021, which were 20,289. In 2022, the total sales volume in our city was around $10.5 billion. In 2021, this number was $13 billion. 

Condominiums in December were selling for an average of $434,973, this is a 9% increase from prices in 2021. Residential properties, however, are down 7% from last year, for an average sale price of $655,839. Year to date, prices are up 7% from last year in residential properties and 8% for condominiums. This is due to the high sales prices we experienced at the beginning of the year averaging out the lower prices later in the year. 

In terms of inventory, Ottawa’s residential class property inventory has increased to 3.7 months of inventory. It was 0.9 months this time last year. In condominiums, inventory is now at 3.9 months instead of 0.9 in December 2021. 

Rentals

The Ottawa Real Estate Board assisted in renting 6,105 properties in 2022, up a considerable amount from the 4,813 properties rented in 2021. 

OREB is bringing in a new president for 2023, Ken Dekker. Ken explains that “December’s performance was in stark contrast to the very active resale market that opened 2022” but notes that “while it’s quieter than the frantic pace we experienced in 2021, it is now a balanced market.” This means there is no reason to panic! Although we are used to a very fast paced market where sellers have the upper hand, we’re seeing a ‘balanced’ market, which means buyers and sellers are experiencing a level playing field for the first time in a while.

Important to note is that these statistics can only be as accurate as there are condos sold in Ottawa. The more condos sold in an area, the more accurate the averages will be.

Want to chat about your options? Fill out the form at the bottom of the page, or text/call us directly 613-900-5700 or fill out the form at the bottom of the page.

Do you have any questions about how this information affects your investment or looking for more information to make the best decision about your purchase? Let’s chat! Fill out the form on the bottom of the page.

Selling Your Condo in Ottawa in the Winter

If you’re cautious about selling your Ottawa condo during the winter season, you’re not alone. You’ve probably heard that the winter is a slow season, that people typically aren’t looking to move, or that you’d be wise to wait until the spring. However, that isn’t always true. Let’s break down some of the pros and cons of selling your condo during the winter season.

Pros:

Although there are fewer buyers shopping in the winter season, those who are are more serious about finding a home. You can assume if they are looking during the winter ‘slow’ season, that it is imperative they move relatively soon! Because of this, you may actually get away with fewer showings and more interested parties earlier on.

Because the winter market is slow, you’ll also have fewer competitors in your specific market. During the spring, you may find that plenty of condos similar to yours are on the market. In the winter, you may be the only one, meaning you’ll have more interested buyers coming right to you.

Another benefit of starting your journey to sell your condo in the winter is it gives you more time if you need it. If after meeting with your real estate agent you realize you’d like to upgrade the floors for example, even if it takes longer than expected, the market is heating up as you do it, so you’ll still benefit from an easier sale. If you decided to do the same in the summer, you might have the opposite.

Finally, after the holidays, we typically see an increase of people browsing for new homes. It’s a great time to be on the market because your home will be seen by a large number of people who are getting started on their buyer’s journeys!

Cons:

Despite these benefits, there are definitely some ways that selling a condo in the winter is difficult. First and foremost, the exterior of your building and any outdoor amenities may be hard to photograph for your listing. You may be able to bypass this if your real estate agent has previously listed a home in your condo, or if they have connections to the building and can access photos from the initial marketing of the building. Snow and ice typically don’t perform well, and some outdoor amenities may be totally closed off.

A second issue with the snow and ice is keeping your home clean while potential buyers visit for showings or open houses. A pro tip from our team, get a large and thick rug for your front entrance to give people adequate space to remove their shoes!

Although fewer buyers mean more serious buyers, it also means that your property may be on the market for longer than you’d like. If you’re looking for a quick closing, you’ll need to work with your real estate agent to create a plan to try and get that done.

Winter is also cold and flu season, meaning you may find more showings getting cancelled, and you may be at a larger risk of getting sick by welcoming so many people into your home. We always offer our clients hand sanitizer for all showings and open houses, but there is definitely more risk during this season!

Overall, there is no one perfect time for everyone to put their property up for sale. If you are considering selling, the best thing that you can do is work with an expert realtor who can help develop a plan for you and your property based on your needs! Whether you’re prioritizing a high-priced sale, a quick closing, or are just testing the waters… working with an expert will help you ensure you’re making all the right choices.

Ottawa Condo Market Statistics - November 2022

Every month we take a closer look and drill down the sales data of Ottawa condos from the previous month. Here are the statistics for November 2022 in the top five "downtown" areas - Centretown, Byward Market and Sandy Hill, Little Italy (which includes Lebreton Flats), Hintonburg, and Westboro. The information will be specific to apartment-style condominiums, and only what sold through the MLS. Also important to note that DOM (Day's On Market) is calculated to include the conditional period, which in Ottawa is roughly 14 days for almost every single transaction.


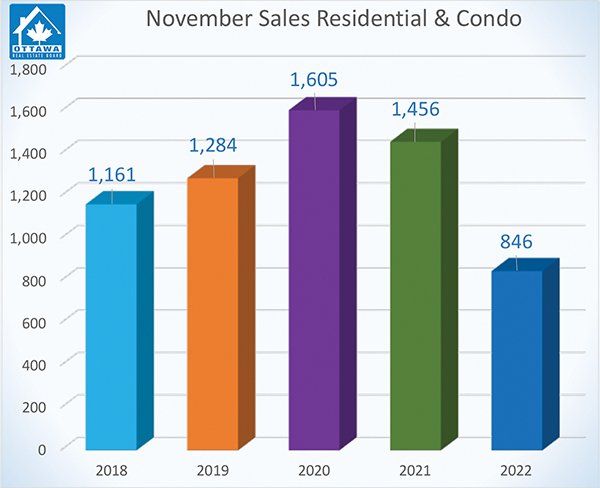
In the month of November, Ottawa Real Estate Board members sold 846 residential properties - down 42% from November 2021. 658 of these were residential, down 39%, and 188 were condominiums, down 50%. This is also a significant decrease from the 5-year average of sales in the month of November, which is 1270.

The president of the Ottawa Real Estate Board, Penny Torontow, explains that November’s sales are typically lower as the real estate market comes to a lull during the holiday season. But they also reflect the state of our economy. She explains that many people who can are waiting and watching to see what happens next, as our market is changing so quickly, and similar trends are appearing all over the world.

Prices are also decreasing. The average condominium this November cost $415,533, which is a decrease of 4% from November last year. The same is clear in residential housing, where the average property cost $680,031, a decrease of 5% from November last year.

So far, the year-to-date average for sale prices is $774,422 for residential homes and $454,436 for condominiums, which is still an 8% increase over 2021.

This new market has had a huge impact on first-time home buyers, Torontow explains. The massive decrease in condo sales illustrates that entry-level properties are becoming less attainable to their market. A quickly changing market and increased stress test requirements are forcing first-time buyers to stay on the sidelines in a rental market that is seeing a large uptick in prices as well.

In terms of inventory, we’ve seen a huge increase in residential properties from 0.9 months last year to 3.5 months this year. For condos, this has increased from 1.1 to 3.4 months. There was also a 12% increase in listed properties this month versus November 2021, from 1429 to 1598, but this is a 22% decrease from the 2046 listed in October of 2022. It is higher than the 5 year average for November of 1398 listed properties.

Torontow explains these new numbers illustrate a balanced market that is starting to tip towards the buyers. Sellers should work with an experienced agent who understands how to appropriately price a home and list it at an ideal time.

Important to note is that these statistics can only be as accurate as there are condos sold in Ottawa. The more condos sold in an area, the more accurate the averages will be.

Want to chat about your options? Fill out the form at the bottom of the page, or text/call us directly 613-900-5700 or fill out the form at the bottom of the page.

Do you have any questions about how this information affects your investment or looking for more information to make the best decision about your purchase? Let’s chat! Fill out the form on the bottom of the page.

Ottawa Condo Market Statistics - October 2022

Every month we take a closer look and drill down the sales data of Ottawa condos from the previous month. Here are the statistics for October 2022 in the top five "downtown" areas - Centretown, Byward Market and Sandy Hill, Little Italy (which includes Lebreton Flats), Hintonburg, and Westboro. The information will be specific to apartment-style condominiums, and only what sold through the MLS. Also important to note that DOM (Day's On Market) is calculated to include the conditional period, which in Ottawa is roughly 14 days for almost every single transaction.


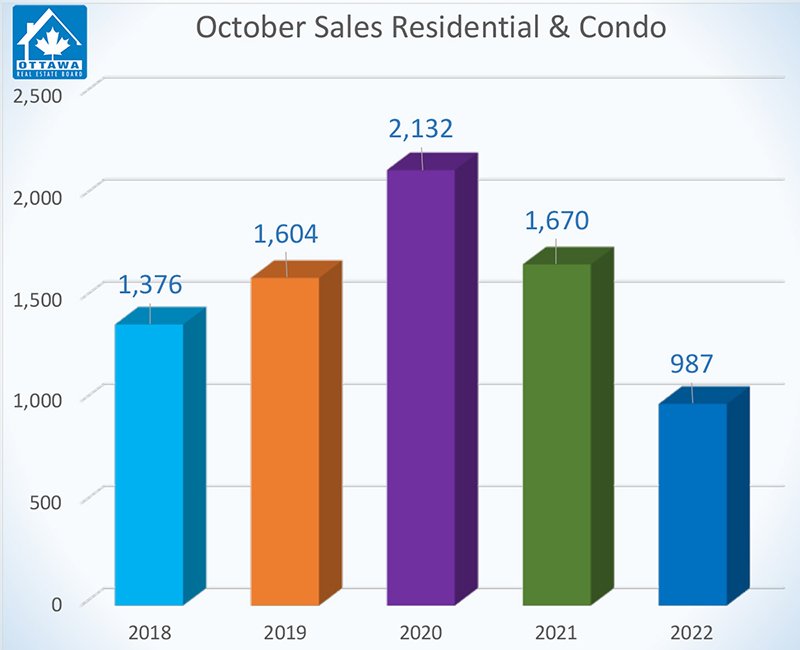
This month in Ottawa, members of the real estate board sold 987 residential properties. This is down nearly 41% from October’s sales in 2021, which were 1670. Residential properties are down 40%, and condominium properties are down 44%. This is also down a similar percentage from the 5 year average of 1554. 

Penny Torontow, OREB President, explains that after the rush of the pandemic, the market is correcting itself. This, with the added stress of increased interest rates, has changed the market drastically over the past few months. It has caused buyers to be more hesitant and has taken the purchasing power away from plenty of people, especially first time home buyers.

However, Torontow explains that demand is still high. Despite this, with larger inventory than before, buyers are able to take their time and have more options available when they look to purchase a home. Buyers are taking a “wait and see” approach in some instances, making sure they’re monitoring the interest rate situation. 

It is reasonable for sellers to feel concerned about the quickly changing housing situation in Canada. Despite this, Torontow explains that real estate is a long term investment. The growth we saw in our market over the past 2 years was unsustainable. She explains “if you have owned your property for any length of time, your equity has increased significantly and will buffer price corrections. If you buy and sell in the same market, it is all relative.”

In terms of inventory, we are looking at 3.3 months for residential and 3 months for condominiums. That is up significantly from 2021 where we saw 1 month of inventory for residential, and 1.2 months for condominiums. 

Listings this month were actually higher than October 2021. We saw 2047 listings this year versus 1960 last year. This is also higher than the 5 year average of 1971. 

Torontow explains that buyers and sellers should be aware of their own circumstances. It is important not to fall for a one size fits all approach when it comes to the market right now. Torontow says that “real estate has been and continues to be a good investment over time. They don’t have a crystal ball, but mortgage brokers and REALTORS® have the education, expertise, and most importantly, the data - to help people make an informed decision for their specific situation.”

Rentals are also up considerably this year. Last year we saw 4012 rentals in the month of October. In 2022, we saw 5168.

Important to note is that these statistics can only be as accurate as there are condos sold in Ottawa. The more condos sold in an area, the more accurate the averages will be.

Want to chat about your options? Fill out the form at the bottom of the page, or text/call us directly 613-900-5700 or fill out the form at the bottom of the page.

Do you have any questions about how this information affects your investment or looking for more information to make the best decision about your purchase? Let’s chat! Fill out the form on the bottom of the page.

Higher Interest Rates and Housing Prices with Mitch MacKenzie

Is now a good time to buy or sell? This is the question fluttering around the real estate market in Ottawa. 

We sat down with Mitch MacKenzie to take a look at what the numbers say about the Ottawa condo market.

Below are Mitch’s statistics - let’s dive into what they mean.
As the interest rate has risen this year, we’ve seen a slight dip in condo prices throughout the summer. 

September has been the highest month for average condo prices this year. Despite this, August was actually the second lowest average price we’ve seen this year, just behind June.

This trend suggests that prices have been on a downward turn throughout the summer. Although last month was a high point, it is important to pay attention to the overall trend for the past few months, because monthly statistics are only a small snapshot of overall yearly trends. They can be skewed by one incredibly expensive (or inexpensive) property, or other flukes in single sales. 

Further, a rough idea for down payments illustrates that if prices continue to drop as they seem to be, these prices from sellers who are trying to appeal to cautious buyers may actually be an added benefit - as these prices drop, they combat the rising interest rates and provide a monthly payment similar to those before interest rates rose at all! 

For example, comparing January and February average payments of $2127-$2160 with June and August’s $2208-$2327, there is only a slight increase in average monthly payments. 

If prices drop further, we may see a complete leveling out which combats interest rates - at least in Ottawa’s condo market. 

This means buyers may finally start to see the upper hand again. 

Furthermore, we are seeing a huge increase in inventory as houses are on market for longer. This means buyers have more options and less rush to put in an offer. They can also utilize more conditions to protect themselves.

Average down payments have also been down on average this summer - from around $100,000 in the winter months to as low at $92,000 this summer!

Ottawa Condo Market Statistics - September 2022

Every month we take a closer look and drill down the sales data of Ottawa condos from the previous month. Here are the statistics for September 2022 in the top five "downtown" areas - Centretown, Byward Market and Sandy Hill, Little Italy (which includes Lebreton Flats), Hintonburg, and Westboro. The information will be specific to apartment-style condominiums, and only what sold through the MLS. Also important to note that DOM (Day's On Market) is calculated to include the conditional period, which in Ottawa is roughly 14 days for almost every single transaction.


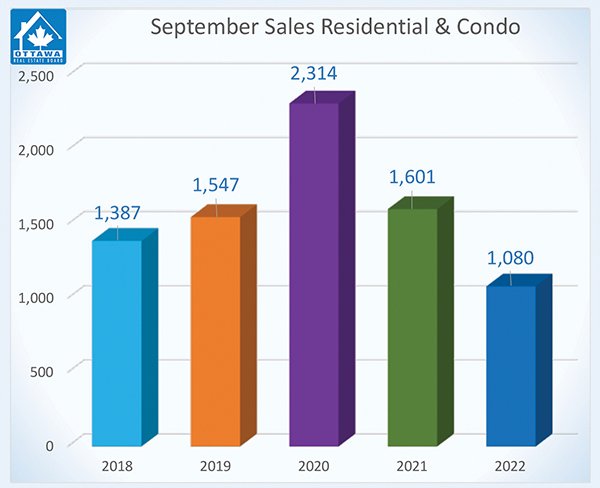
This month, Ottawa real estate agents sold a total of 1080 properties, down 33% compared to September last year. The decrease is higher in residential properties, down 34%, than it is in condos, down 27%. This is also significantly lower than the 5 year average of 1586. 

This is illustrative of buyer’s hesitancy about rising interest rates, OREB’s president Penny Torontow says. The mortgage stress test and inflation in the country has caused a lot of buyers to stop their search for the time being.
However, we’ve seen an increase of new listings that have entered the market! These are now higher than not only last month, but also last year, and the five year average. This means that the market is coming closer into balance. Buyers and sellers can now take the time to weigh their options and see what works best for their situation. 

Inventory in residential properties is up to 3.1 months. It was 1.2 this time last year! For condos, we’re seeing 2.7 months inventory compared to 1.6 last year. New listings are 5% higher than in 2021 and 13% higher than this August. 

We are also seeing prices begin to stabilize month to month, but are still increasing in yearly trends. Average condo prices are up 6% from 2021 to $450,987. Residential properties are up an average of 0.5% at $706,658.

Important to note is that these statistics can only be as accurate as there are condos sold in Ottawa. The more condos sold in an area, the more accurate the averages will be.

Want to chat about your options? Fill out the form at the bottom of the page, or text/call us directly 613-900-5700 or fill out the form at the bottom of the page.

Do you have any questions about how this information affects your investment or looking for more information to make the best decision about your purchase? Let’s chat! Fill out the form on the bottom of the page.

Ottawa Condo Market Statistics - August 2022

Every month we take a closer look and drill down the sales data of Ottawa condos from the previous month. Here are the statistics for August 2022 in the top five "downtown" areas - Centretown, Byward Market and Sandy Hill, Little Italy (which includes Lebreton Flats), Hintonburg, and Westboro. The information will be specific to apartment-style condominiums, and only what sold through the MLS. Also important to note that DOM (Day's On Market) is calculated to include the conditional period, which in Ottawa is roughly 14 days for almost every single transaction.


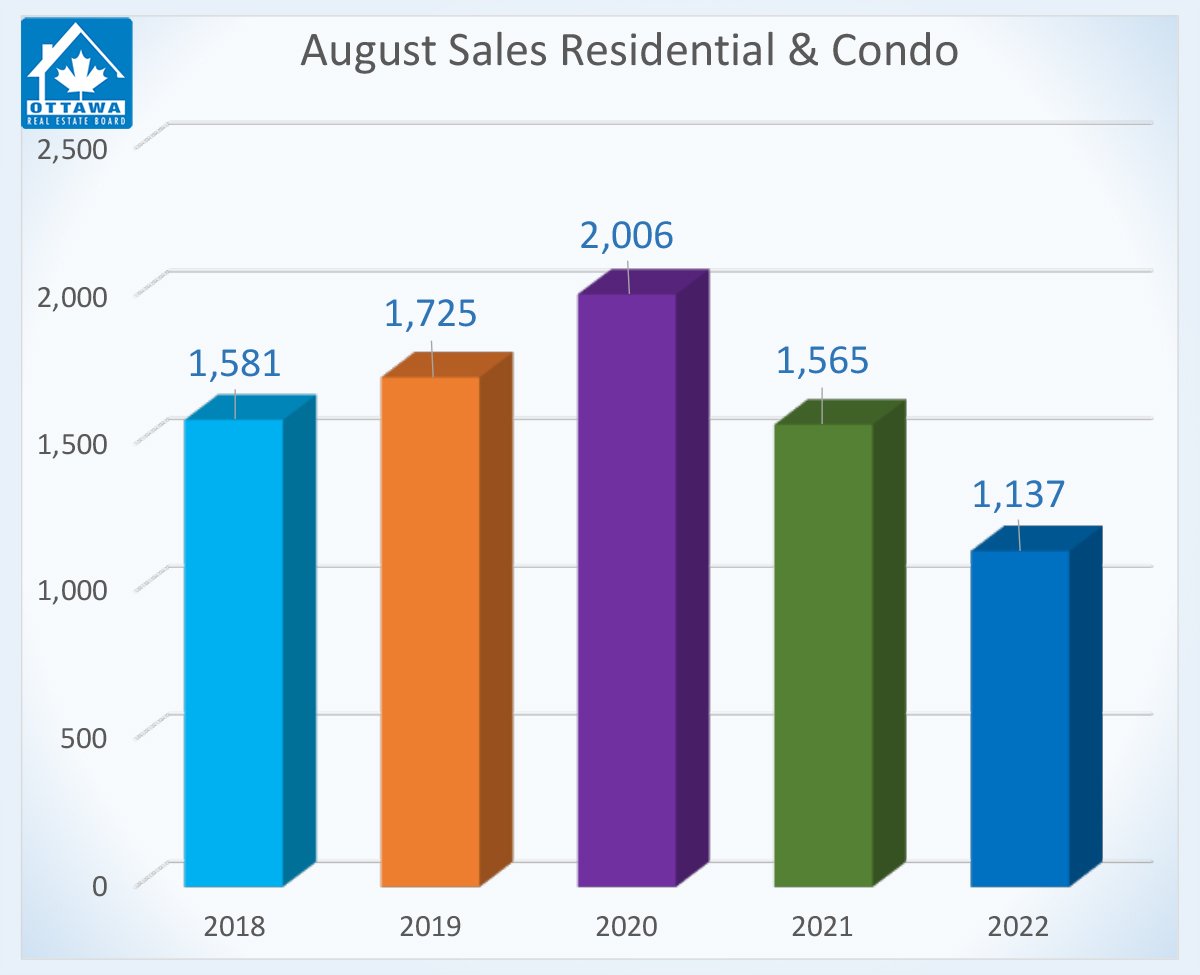
This month, the Ottawa Real Estate Board recorded 1137 residential real estate transactions, down 27% from 1565 in August 2021. This number is made up of 850 residential properties and 287 condominiums, decreases of 27-28% compared to this month last year. These numbers are also down significantly compared to the five-year average of 1600 sales.

The Ottawa Real Estate Board president, Penny Torontow, explains that August is traditionally a slower month in Ottawa for real estate due to summer vacations, school prep, and more. In addition, buyers are unsure about their ability to purchase homes, and at what budget, due to interest rate changes over the past few months.

The state of the market at the beginning of 2022 was unsustainable. As the market begins to slow, we can see the average days on market increasing, coming closer to 30 days. In addition, we’ve seen a return to the typical financing and inspection conditions on buyer contracts that were being skipped in order for buyers to make the most competitive offer. Homes are also seeing less multiple offer scenarios.

Condo prices are still increasing, up 4% from this month last year to an average of $421,966. Residential properties are also up 5% for an average of $707,712. Year-to-date, these numbers are even higher, up 9-10% at an average of $457,771 for condominiums and $795,978 for residential homes.

2,093 properties were listed this month, increasing our inventory to nearly 3 months for residential homes and 2.2 months for condominiums.

Torontow explains that prices are still high and rising, although the percent by which they are rising is getting smaller, down to the single-digit percentages now. We are moving towards a more balanced market, which means that buyers will have more choice and sellers will have to be more mindful about how they choose to price their properties.

Important to note is that these statistics can only be as accurate as there are condos sold in Ottawa. The more condos sold in an area, the more accurate the averages will be.

Want to chat about your options? Fill out the form at the bottom of the page, or text/call us directly 613-900-5700 or fill out the form at the bottom of the page.

Do you have any questions about how this information affects your investment or looking for more information to make the best decision about your purchase? Let’s chat! Fill out the form on the bottom of the page.

Ottawa Condo Market Statistics - July 2022

Every month we take a closer look and drill down the sales data of Ottawa condos from the previous month. Here are the statistics for July 2022 in the top five "downtown" areas - Centretown, Byward Market and Sandy Hill, Little Italy (which includes Lebreton Flats), Hintonburg, and Westboro. The information will be specific to apartment-style condominiums, and only what sold through the MLS. Also important to note that DOM (Day's On Market) is calculated to include the conditional period, which in Ottawa is roughly 14 days for almost every single transaction.


This month, Ottawa real estate agents sold 1110 residential properties. This is down 35% from this month last year, when agents sold 1718. 840 of these were residential properties (a 36% decrease) and 270 were condos (a 34% decrease). This is also greatly below the 5 year average of 1691 properties sold in the month of June. 

Penny Torontow explains that this is a major slowing of our real estate market. Buyers are even less motivated to buy than the usual ‘summer lull’ we see in a typical year. She explains that the interest rate hikes as well as other factors are contributing to buyers wanting to ‘wait and see.’ Torontow explains this isn’t necessarily a bad thing though, because as more homes hit the market and less buyers are motivated to buy, we’re getting closer to a balanced market. 

Listings added to the market are very regular compared to the 5 year average and only a slight decrease from last July, when the market was booming. This has boosted our inventory of residential properties to 2.9 months and condos to 2.5 months. We’re moving quickly towards a balanced market, which would mean 4 months of inventory. 

Average prices are still increasing, 1% from last year in condominiums and 5% from last year in residential homes. This is a significantly slower increase than previous years though, where we were seeing double digit percentage increases year over year. 

Sellers must prepare to be more patient as days on market return to typical lengths. Buyers have more choice and less pressure to buy. Because of this, they may be touring more houses and taking more time to make their decisions. Rising costs of just about everything also means more buyers are taking a breath to evaluate their finances in this changing world before making offers. 

In contrast, rentals are up significantly, with Ottawa agents renting out 3528 properties year to date, compared to 2706 the previous year. 

Important to note is that these statistics can only be as accurate as there are condos sold in Ottawa. The more condos sold in an area, the more accurate the averages will be.

Want to chat about your options? Fill out the form at the bottom of the page, or text/call us directly 613-900-5700 or fill out the form at the bottom of the page.

Do you have any questions about how this information affects your investment or looking for more information to make the best decision about your purchase? Let’s chat! Fill out the form on the bottom of the page.

Ottawa Condo Market Statistics - June 2022

Every month we take a closer look and drill down the sales data of Ottawa condos from the previous month. Here are the statistics for June 2022 in the top five "downtown" areas - Centretown, Byward Market and Sandy Hill, Little Italy (which includes Lebreton Flats), Hintonburg, and Westboro. The information will be specific to apartment-style condominiums, and only what sold through the MLS. Also important to note that DOM (Day's On Market) is calculated to include the conditional period, which in Ottawa is roughly 14 days for almost every single transaction.


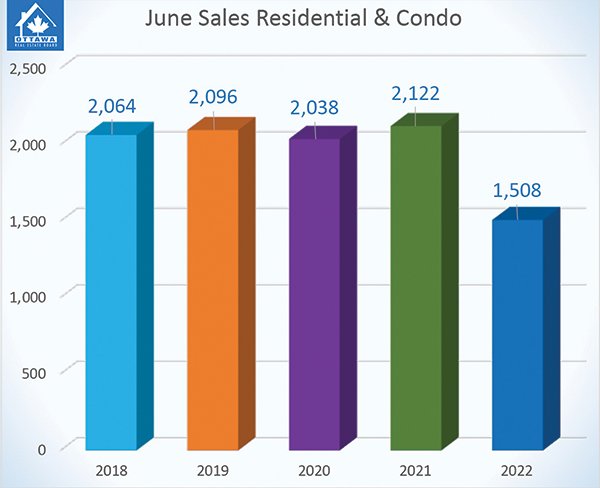
This month, members of the Ottawa Real Estate board sold 1,508 residential properties. This is down a significant amount from 2,122 in June 2021. Residential property sales are down 31% and condo sales are down 23%. 

Penny Torontow explains that Ottawa’s market is becoming more normal now, and we’re seeing a more typical ebb and flow cycle. 

We can also assume that a higher cost of living and inflation are contributing to the discouragement many people feel about buying homes. Also, Torontow explains, that ‘buyer fatigue’ caused be waiting to see about home prices may also contribute to lower confidence in consumers. All this, and the rising gas prices, may be slowing down Ottawa resident’s motivation to purchase a home. 

Prices are now at a 1% increase in condo prices and a 6% increase in residential home prices. Residential inventory has also increase 38% over this time last year, and condominium has increased 14%. 

Torontow explains now might be a great time to buy as there is more inventory and less bidding wars.

Important to note is that these statistics can only be as accurate as there are condos sold in Ottawa. The more condos sold in an area, the more accurate the averages will be.

Want to chat about your options? Fill out the form at the bottom of the page, or text/call us directly 613-900-5700 or fill out the form at the bottom of the page.

Do you have any questions about how this information affects your investment or looking for more information to make the best decision about your purchase? Let’s chat! Fill out the form on the bottom of the page.

Ottawa Condo Market Statistics - May 2022

Every month we take a closer look and drill down the sales data of Ottawa condos from the previous month. Here are the statistics for May 2022 in the top five "downtown" areas - Centretown, Byward Market and Sandy Hill, Little Italy (which includes Lebreton Flats), Hintonburg, and Westboro. The information will be specific to apartment-style condominiums, and only what sold through the MLS. Also important to note that DOM (Day's On Market) is calculated to include the conditional period, which in Ottawa is roughly 14 days for almost every single transaction.


This past month, there were 1846 residential property sales in Ottawa, compared to 2285 last year - this is a decrease of 19 percent year over year, and is significantly lower than the 5 year average of 2031 sales as well. 

Penny Torontow, Ottawa Real Estate Board’s president, explains that we can see this trend continuing as the market slows from where it was in 2021. With rising interest rates, a higher cost of living, and inflation, sales were already slowing. Add in the intense storm Ottawa suffered mid-month, it only makes sense that people are taking a step back while the community heals. 

Data shows that there was a sharp decline in new listings and a large increase in cancelled/suspended listings after the storm hit Ottawa. 

We also saw a slight decrease in the inventory of condominium units in the city, which isn’t surprising as more and more people, especially first-time home buyers, are investing in condominiums as their pricing is more accessible. 

Despite fewer sales, prices still increased on average from last year, 11% for condos and 8% for residential properties, and a 12% overall increase in price. But prices are slowly adjusting to the market, and are decreasing an average of 1-2% per month. 

We are also seeing more cumulative days on market. Because of this, we are getting closer and closer to a balanced market, because more days on market allows buyers more breathing room to decide what works best for them.

Important to note is that these statistics can only be as accurate as there are condos sold in Ottawa. The more condos sold in an area, the more accurate the averages will be.

Want to chat about your options? Fill out the form at the bottom of the page, or text/call us directly 613-900-5700 or fill out the form at the bottom of the page.

Do you have any questions about how this information affects your investment or looking for more information to make the best decision about your purchase? Let’s chat! Fill out the form on the bottom of the page.

Ottawa Condo Market Statistics - April 2022

Every month we take a closer look and drill down the sales data of Ottawa condos from the previous month. Here are the statistics for April 2022 in the top five "downtown" areas - Centretown, Byward Market and Sandy Hill, Little Italy (which includes Lebreton Flats), Hintonburg, and Westboro. The information will be specific to apartment-style condominiums, and only what sold through the MLS. Also important to note that DOM (Day's On Market) is calculated to include the conditional period, which in Ottawa is roughly 14 days for almost every single transaction.


April was an unexpected month for the real estate market in Ottawa. We saw more days on market for about half of the neighbourhoods we survey, higher list to sold prices, and more properties sold this year everywhere except for the Byward Market. Average selling prices were up considerably in every area.

This month, the Ottawa Real Estate Board sold a total of 1889 properties. This is down 21% from this month last year, which was 2394. It is, however, still higher than the five-year average of 1849, although just slightly!

Penny Torontow explains that things like the rising interest rates, growing buyer frustration, and cooler temperatures this month may have had something to do with the lower sales despite a good number of new listings. Perhaps buyers are waiting to see what happens next. She explains it is still a seller’s market, despite this slowing in the market, and that there are still plenty of bidding wars and multiple offer scenarios in many areas. The average condo sold for 11% more than last year, and residential properties saw a 12% average price increase.

There is still less than a month of inventory in Ottawa, meaning competition is still high. This limited supply and high demand for houses means that the pressure is still on - and prices will remain high.

Condos are also performing slightly better as time goes on, because they are slowly becoming the most reasonable investment for many people - they are the most affordable option, and for many, are becoming the entry-level property type.

Important to note is that these statistics can only be as accurate as there are condos sold in Ottawa. The more condos sold in an area, the more accurate the averages will be.

Want to chat about your options? Fill out the form at the bottom of the page, or text/call us directly 613-900-5700 or fill out the form at the bottom of the page.

Do you have any questions about how this information affects your investment or looking for more information to make the best decision about your purchase? Let’s chat! Fill out the form on the bottom of the page.

Ottawa Condo Market Statistics - March 2022

Every month we take a closer look and drill down the sales data of Ottawa condos from the previous month. Here are the statistics for March 2022 in the top five "downtown" areas - Centretown, Byward Market and Sandy Hill, Little Italy (which includes Lebreton Flats), Hintonburg, and Westboro. The information will be specific to apartment-style condominiums, and only what sold through the MLS. Also important to note that DOM (Day's On Market) is calculated to include the conditional period, which in Ottawa is roughly 14 days for almost every single transaction.


March was off to an interesting start for the condo market in Ottawa! As the spring rush begins, we would expect to see plenty of listings. But compared to last year, listings for the month of march were actually down considerably everywhere but Centretown! We did see an increase in list to sold price in every area except Westboro, however!

The quantity of homes sold has also decreased since this month last year in all places except for Centretown.

Overall, this shows us that the sellers market may actually be slowing down, at least for apartment style condos in Ottawa! Because of this, if you’ve been considering buying a condo, it looks like now is your time. That being said, sellers shouldn’t be worried, as many homes are still going for a considerable amount over listing price!

This month, the Ottawa Real Estate Board sold 2011 residential properties - this is down from 2274 in March of 2021. This is still an increase of 42% from February of this year and 12% higher than the five year average!

This change may be due to the warmer weather last March which encouraged an earlier Spring buying and selling season. It is also worth noting that many restrictions have lifted this month, meaning more people are out and about on vacation and less focused on real estate at the moment.

The average sale price for condos in Ottawa was $479,405. This is a 10% increase from 2021. Residential properties average sale price was also up a considerable amount, 13%, at $853,615. The average price of homes in Ottawa is still on a steady incline.

We are also seeing slightly more houses enter the market over the past 5 years; a 4% increase.

Important to note is that these statistics can only be as accurate as there are condos sold in Ottawa. The more condos sold in an area, the more accurate the averages will be.

Want to chat about your options? Fill out the form at the bottom of the page, or text/call us directly 613-900-5700 or fill out the form at the bottom of the page.

Do you have any questions about how this information affects your investment or looking for more information to make the best decision about your purchase? Let’s chat! Fill out the form on the bottom of the page.

Ottawa Condo Market Statistics - February 2022

Every month we take a closer look and drill down the sales data of Ottawa condos from the previous month. Here are the statistics for February 2022 in the top five "downtown" areas - Centretown, Byward Market and Sandy Hill, Little Italy (which includes Lebreton Flats), Hintonburg, and Westboro. The information will be specific to apartment-style condominiums, and only what sold through the MLS. Also important to note that DOM (Day's On Market) is calculated to include the conditional period, which in Ottawa is roughly 14 days for almost every single transaction.


We are now in our second month of 2022, and the market shows no signs of slowing down! Almost all neighbourhoods saw an increase in the number of listings and an increase in their list to sold price. The average days on market went down significantly in every area except for Hintonburg.

The Ottawa Real Estate Board recorded 1421 residential properties sold this month, compared to 1385 last February - a 3% increase!

326 of these sales were condominiums, which is a 10% decrease from this month last year.

From January to February this year, we saw a 52% increase in transactions. Although this is typical as we move into the spring season and see more and more properties up for sale, this is a larger increase than we have seen in previous years.

OREB President Penny Torontow says this is a sign we may see the spring market “ramp up earlier this year.”

This may also be a sign that people are wary of the new interest rate increase, or perhaps be due to eased pandemic restrictions. We should expect to see the spring market in Ottawa continue to increase in the coming months.

Despite this, with the new increased interest rate and rumours of continued increases, we may also see lessened buyer power in the coming months.

The average condo price was $466,682 while the average residential property was listed at $837,517. These prices are increased 15-17% from the previous year.

The number of new listings may mean that we will see a reversal or slowing of the seller’s market in the coming months, but this will be largely dependent on, as previously mentioned, the buyer power available after the interest rate increases. It is also worth mentioning that although there were more new listings than in previous years, the number of available condominiums is down 20%!

Important to note is that these statistics can only be as accurate as there are condos sold in Ottawa. The more condos sold in an area, the more accurate the averages will be.

Want to chat about your options? Fill out the form at the bottom of the page, or text/call us directly 613-900-5700 or fill out the form at the bottom of the page.

Do you have any questions about how this information affects your investment or looking for more information to make the best decision about your purchase? Let’s chat! Fill out the form on the bottom of the page.

Ottawa Condo Market Statistics - January 2022

Every month we take a closer look and drill down the sales data of Ottawa condos from the previous month. Here are the statistics for January 2022 in the top five "downtown" areas - Centretown, Byward Market and Sandy Hill, Little Italy (which includes Lebreton Flats), Hintonburg, and Westboro. The information will be specific to apartment-style condominiums, and only what sold through the MLS. Also important to note that DOM (Day's On Market) is calculated to include the conditional period, which in Ottawa is roughly 14 days for almost every single transaction.


2022 is off to a great start. Ottawa is currently a sellers’ market, meaning that owners are getting great prices on their homes and offers are highly competitive. Despite this, we have seen a huge increase in sales in the Byward and Sandy Hill area! In other areas, we have seen less sales and listings - this is what causes a sellers’ market! Less availability means that condos and houses are ‘hot commodities’ - there are only a few, so there is more competition to get them!

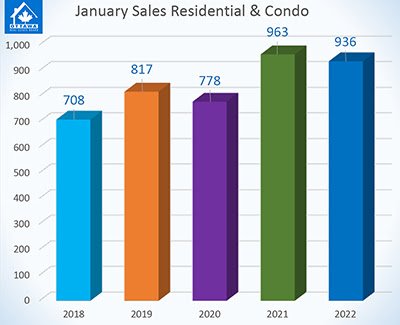
The Ottawa Real Estate Board reported there were 936 residential properties sold in January 2022, compared to 963 in January 2021. 275 of these were condominium, down 5% from January 2021.

Sales in Ottawa this month were almost identical to those of last year. OREB President Penny Torontow says “pent-up buyer demand due to the housing supply shortage” is responsible for price increases and an accelerating market.

The average prices of homes in Ottawa is continuing to rise, pushed by a lack of inventory. Homes in Ottawa over 1 million jumped from 3% of residential Ottawa sales in 2020 to 14% of detached home sales in 2022.

The condo market is doing spectacularly in Ottawa, perhaps due to the fact that many residential homes may be out of reach for Ottawa buyers.

Important to note is that these statistics can only be as accurate as there are condos sold in Ottawa. The more condos sold in an area, the more accurate the averages will be.

Want to chat about your options? Fill out the form at the bottom of the page, or text/call us directly 613-900-5700 or fill out the form at the bottom of the page.

Do you have any questions about how this information affects your investment or looking for more information to make the best decision about your purchase? Let’s chat! Fill out the form on the bottom of the page.