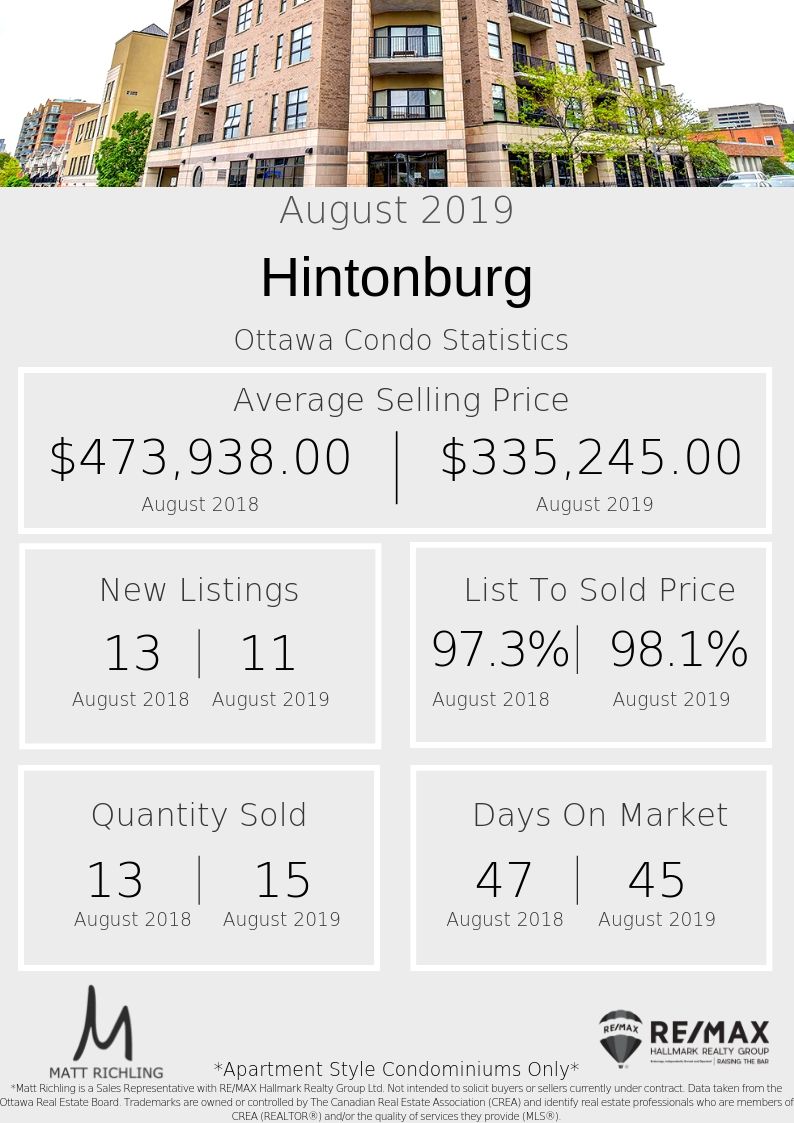
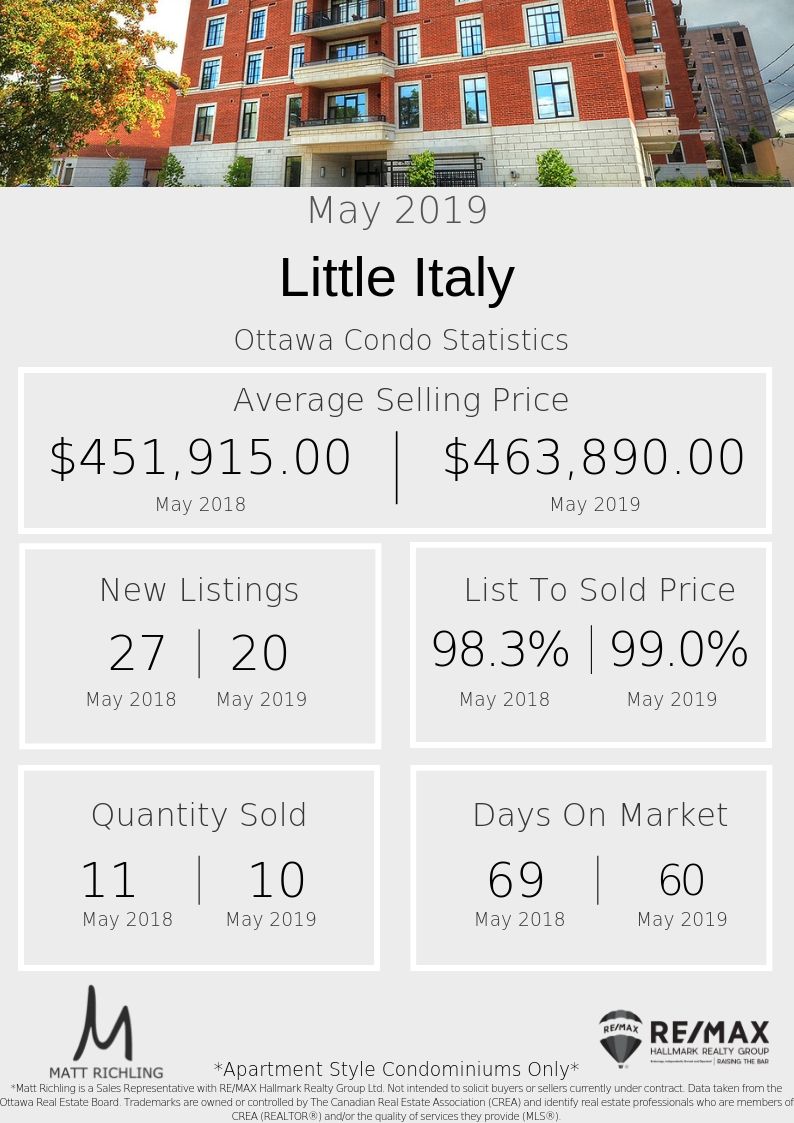
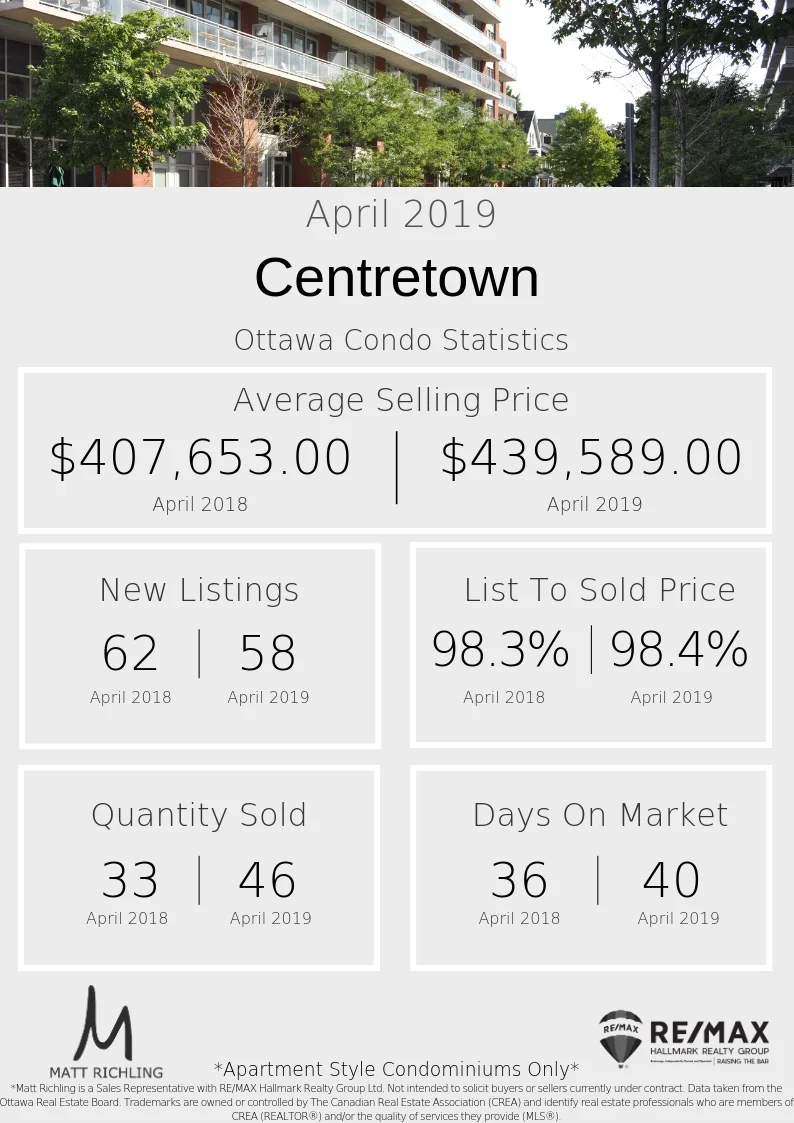
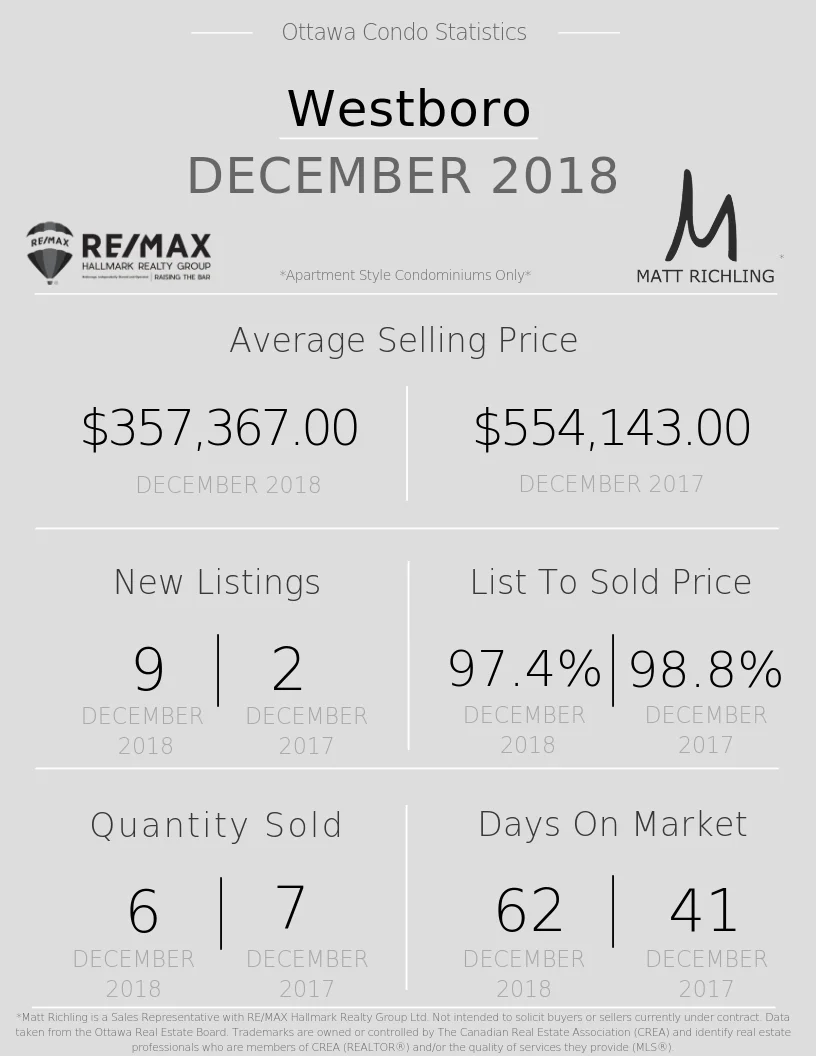
Each month we take a closer look and brake down the sales data of downtown condos from the previous month. Here are the statistics for June and the top five "downtown" area's - Centretown, Byward Market and Sandyhill, Little Italy (which includes Lebreton Flats), Hintonburg, and Westboro. The information will be specific to apartment style condominiums, and only what sold through the MLS. Also, DOM (Day's On Market) is calculated to include the conditional period, which in Ottawa is almost every single transaction to be roughly 10-14 days.
Wow, things keep getting hotter and hotter in the Ottawa condo market. The average selling price, days on market, list to sold price, - all keep getting more intense.
Sellers: While things are doing well for you, we are still seeing properties that don’t sell above asking, and are taking quite a while to sell. It is not as much of a sellers market as one would think. Pricing and how a unit is shown, is more important than ever. I am seeing condos listed both over and under market value (by lack of experience), and seeing condos priced correctly while also zero effort put into preparing for showings. If you had looked at selling over the last few years, but decided to put a tenant inside instead, this might be the time to review the market and data.
Buyers: Patience, preparation, and persistence. Be patient - supply is low right now and the best units will come on the market (maybe not in your price point anymore, but they will list, I promise). This isn’t a crazy sellers market. You have to be able to say no if the unit isn’t what you are looking for. Preparation - Get that mortgage pre-approval now. Know your numbers and what exactly you can afford. Being able to walk into the offer process with shorter timelines will make you stand out and give you more confidence with your offer. Persistence - Again, there is a supply shortage. The best units will come on the market, will just need to wait it out. We are also seeing more and more multiple offer scenarios, which means that you have a larger chance of loosing out if you don’t act quickly or are not prepared. If you do loose out, don’t give up!