Blog — Matt Richling - Ottawa Condos and Lofts - Ottawa Real Estate For Sale

Matt Richling is a licensed Salesperson with RE/MAX Hallmark Realty Group.

Ottawa Condo Market

Ottawa Condo Market Statistics - August 2019

Ottawa-Condo-Stats-and-Data.jpg

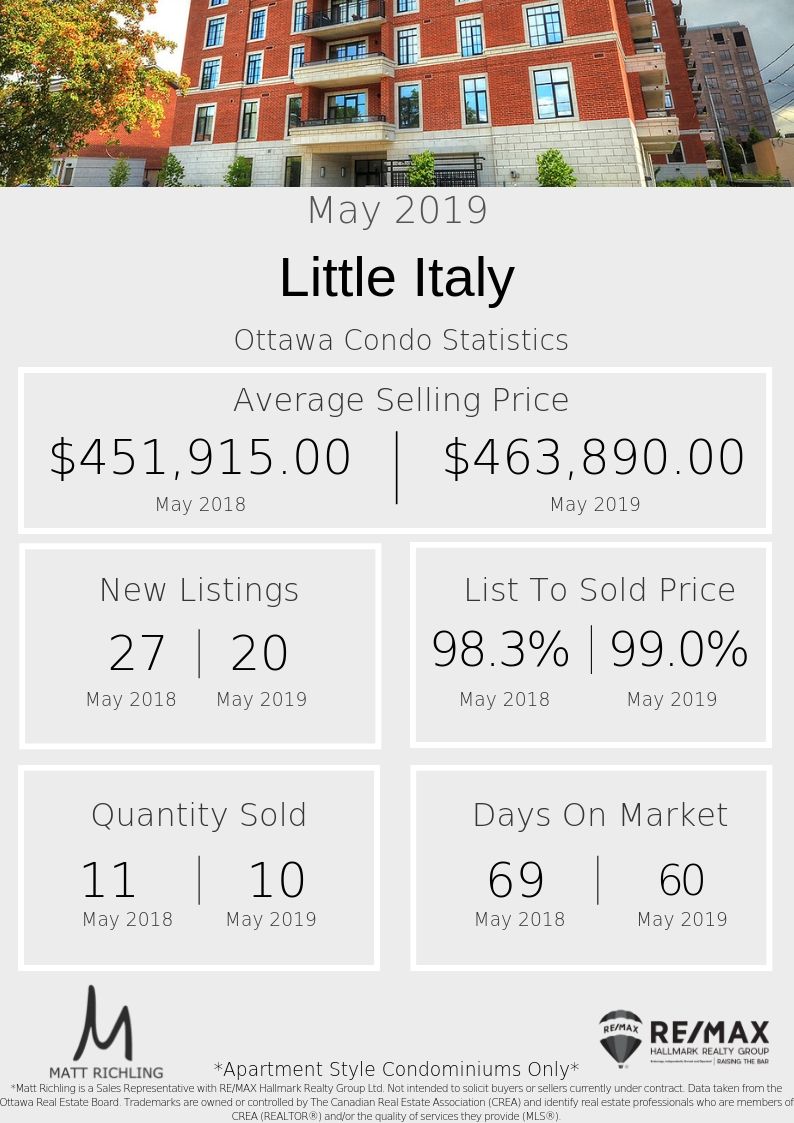
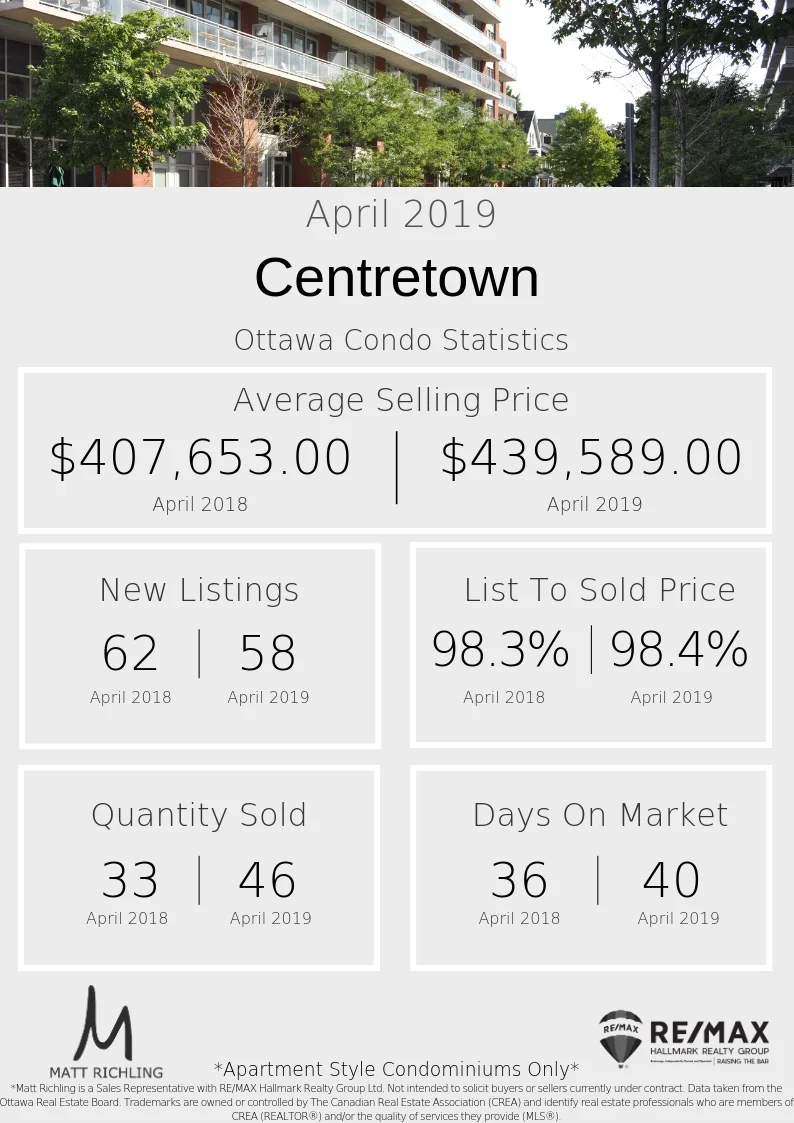
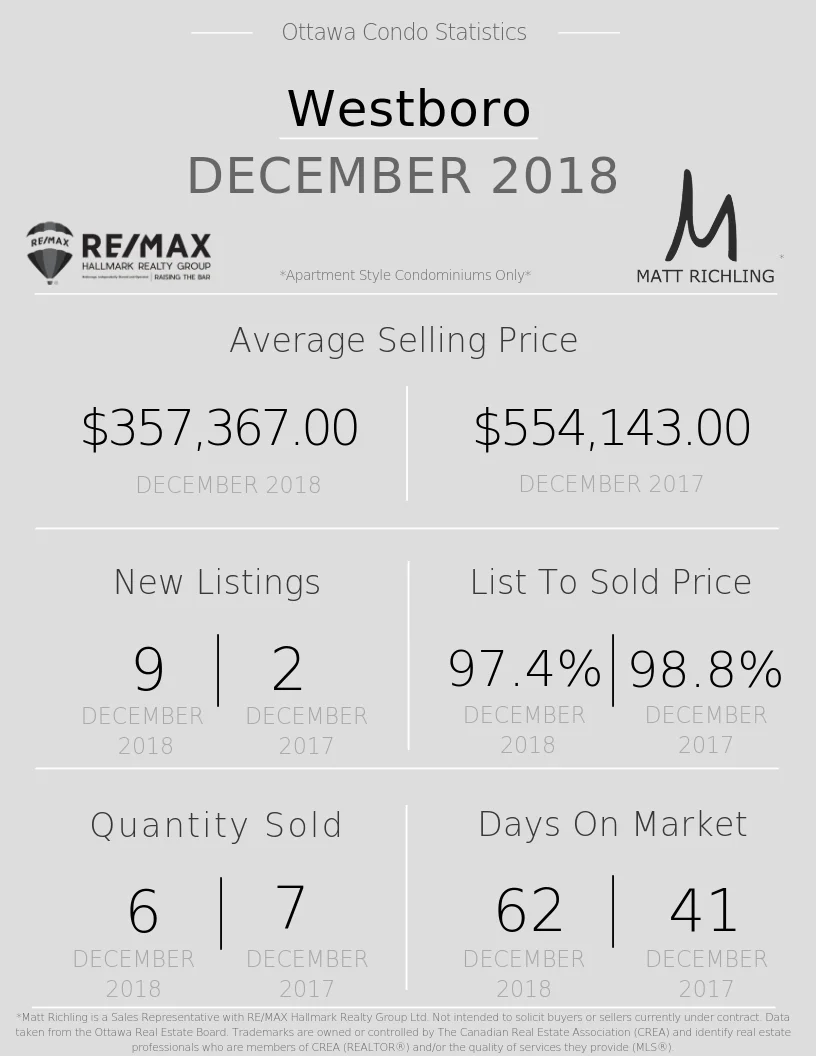
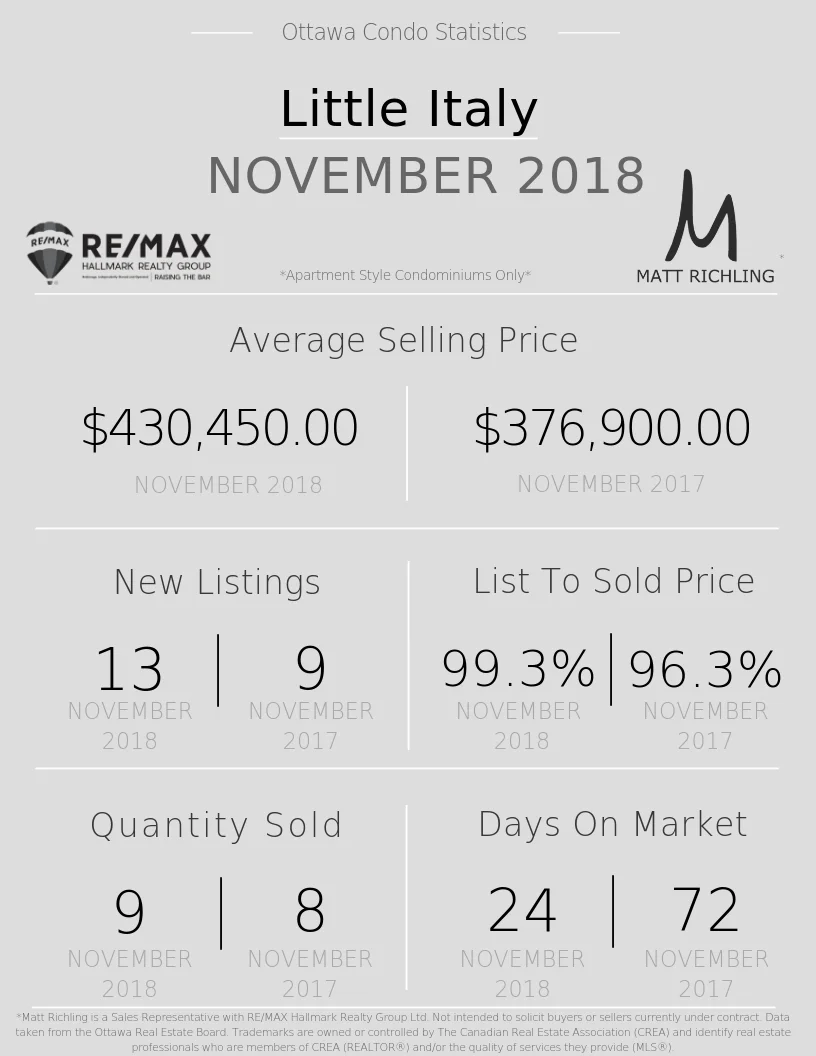
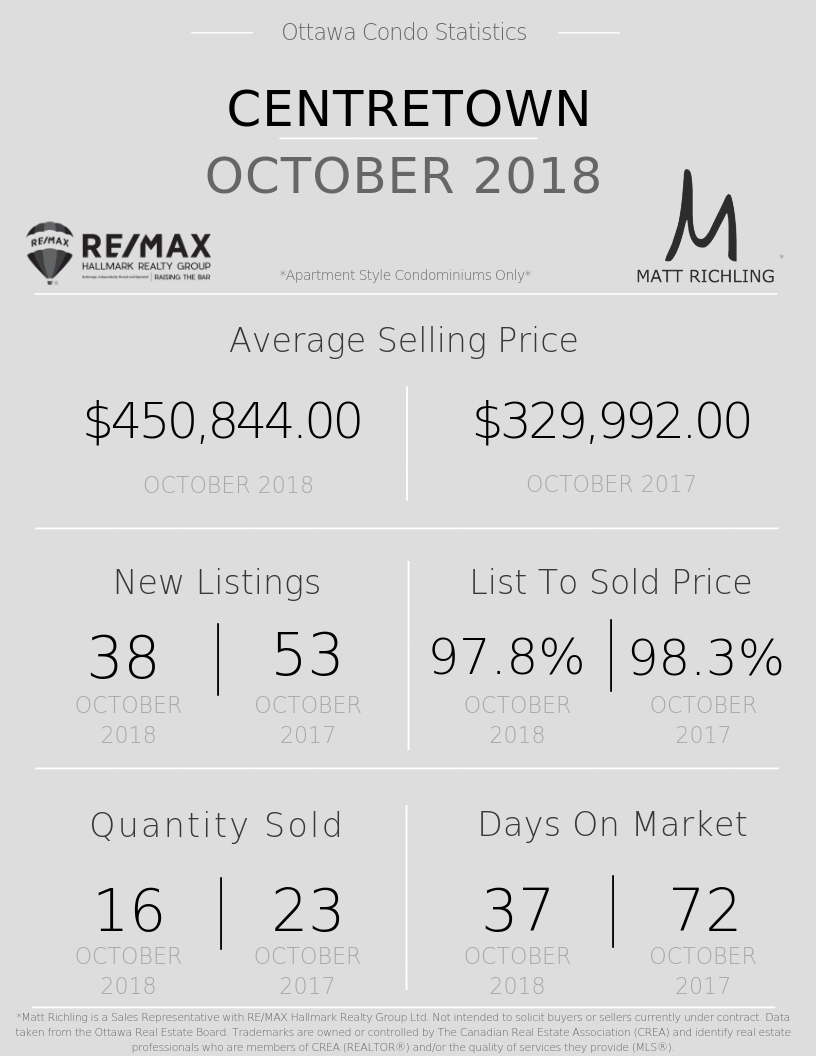
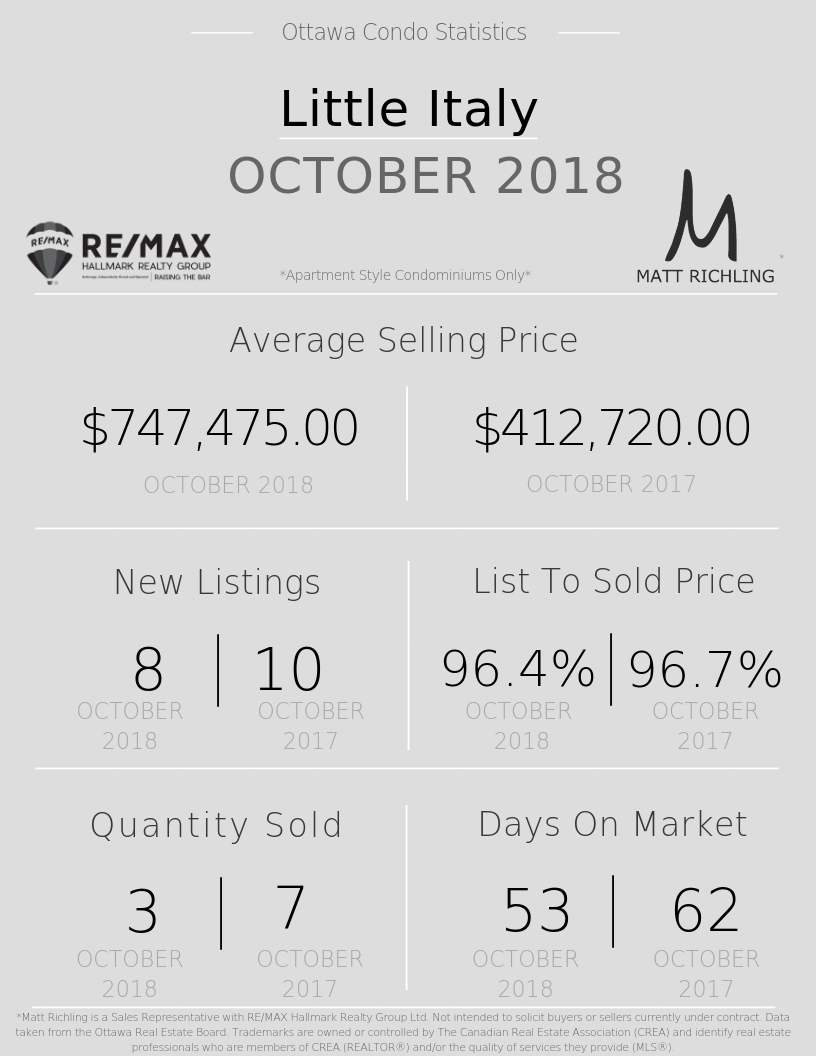
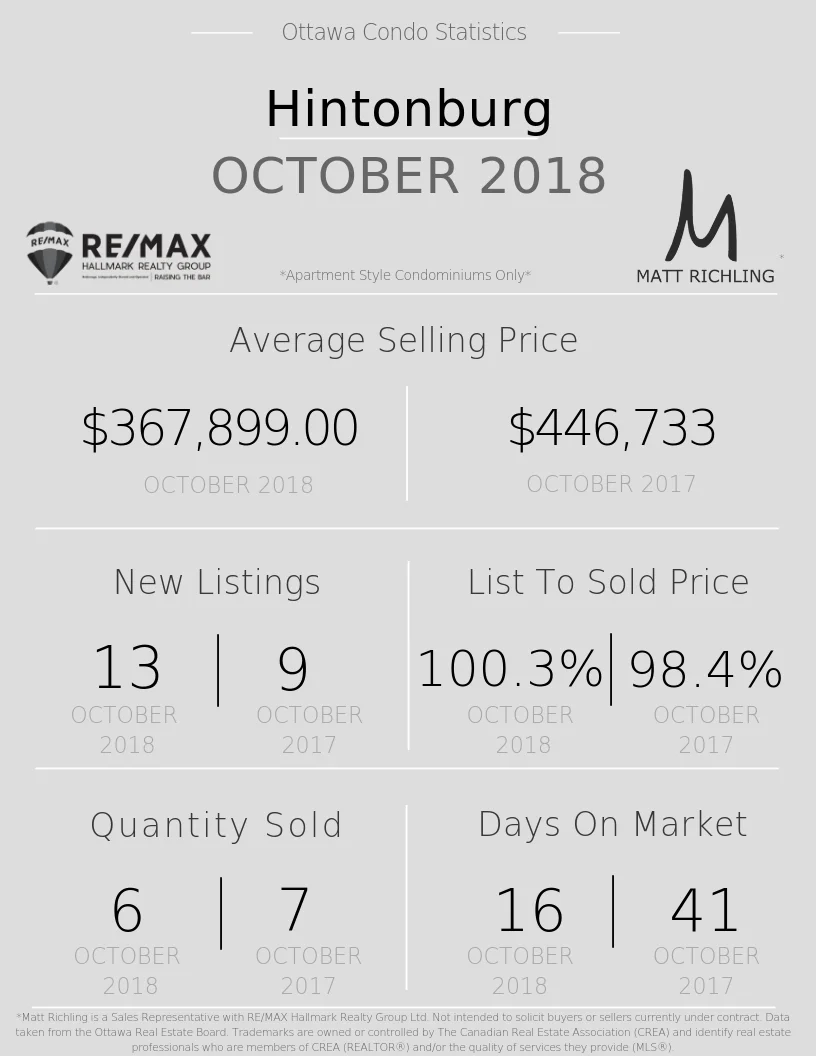
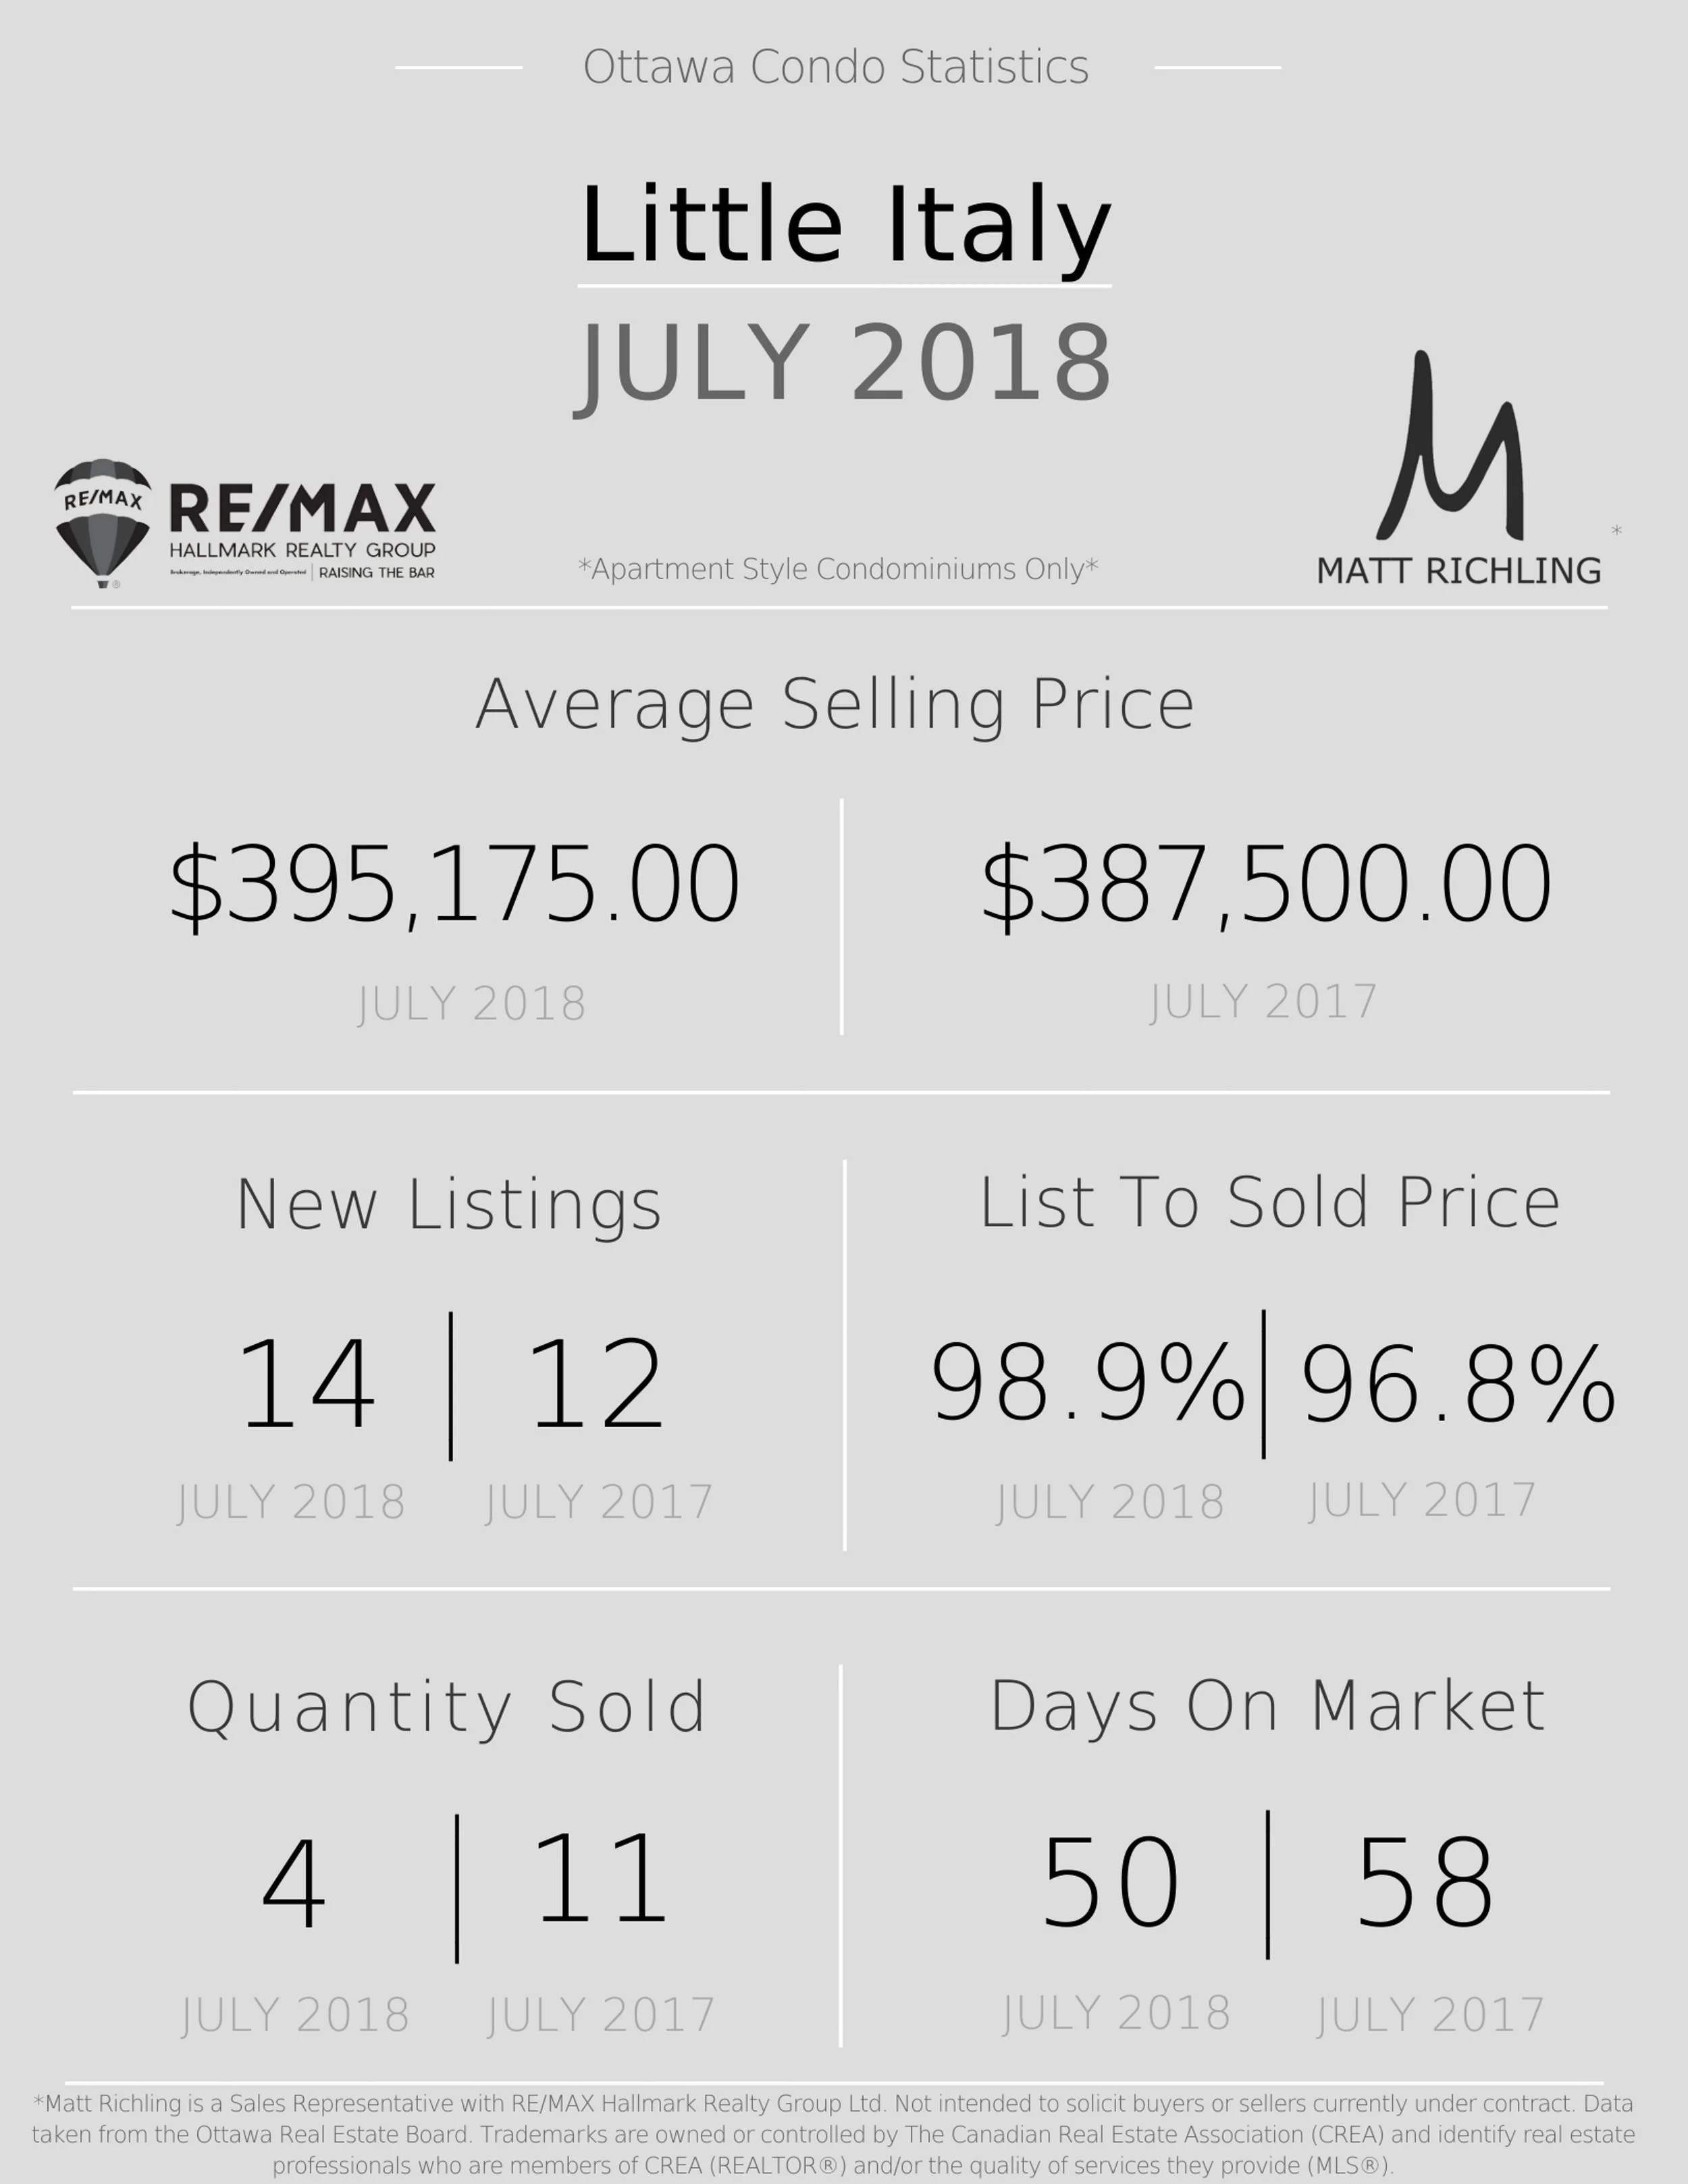
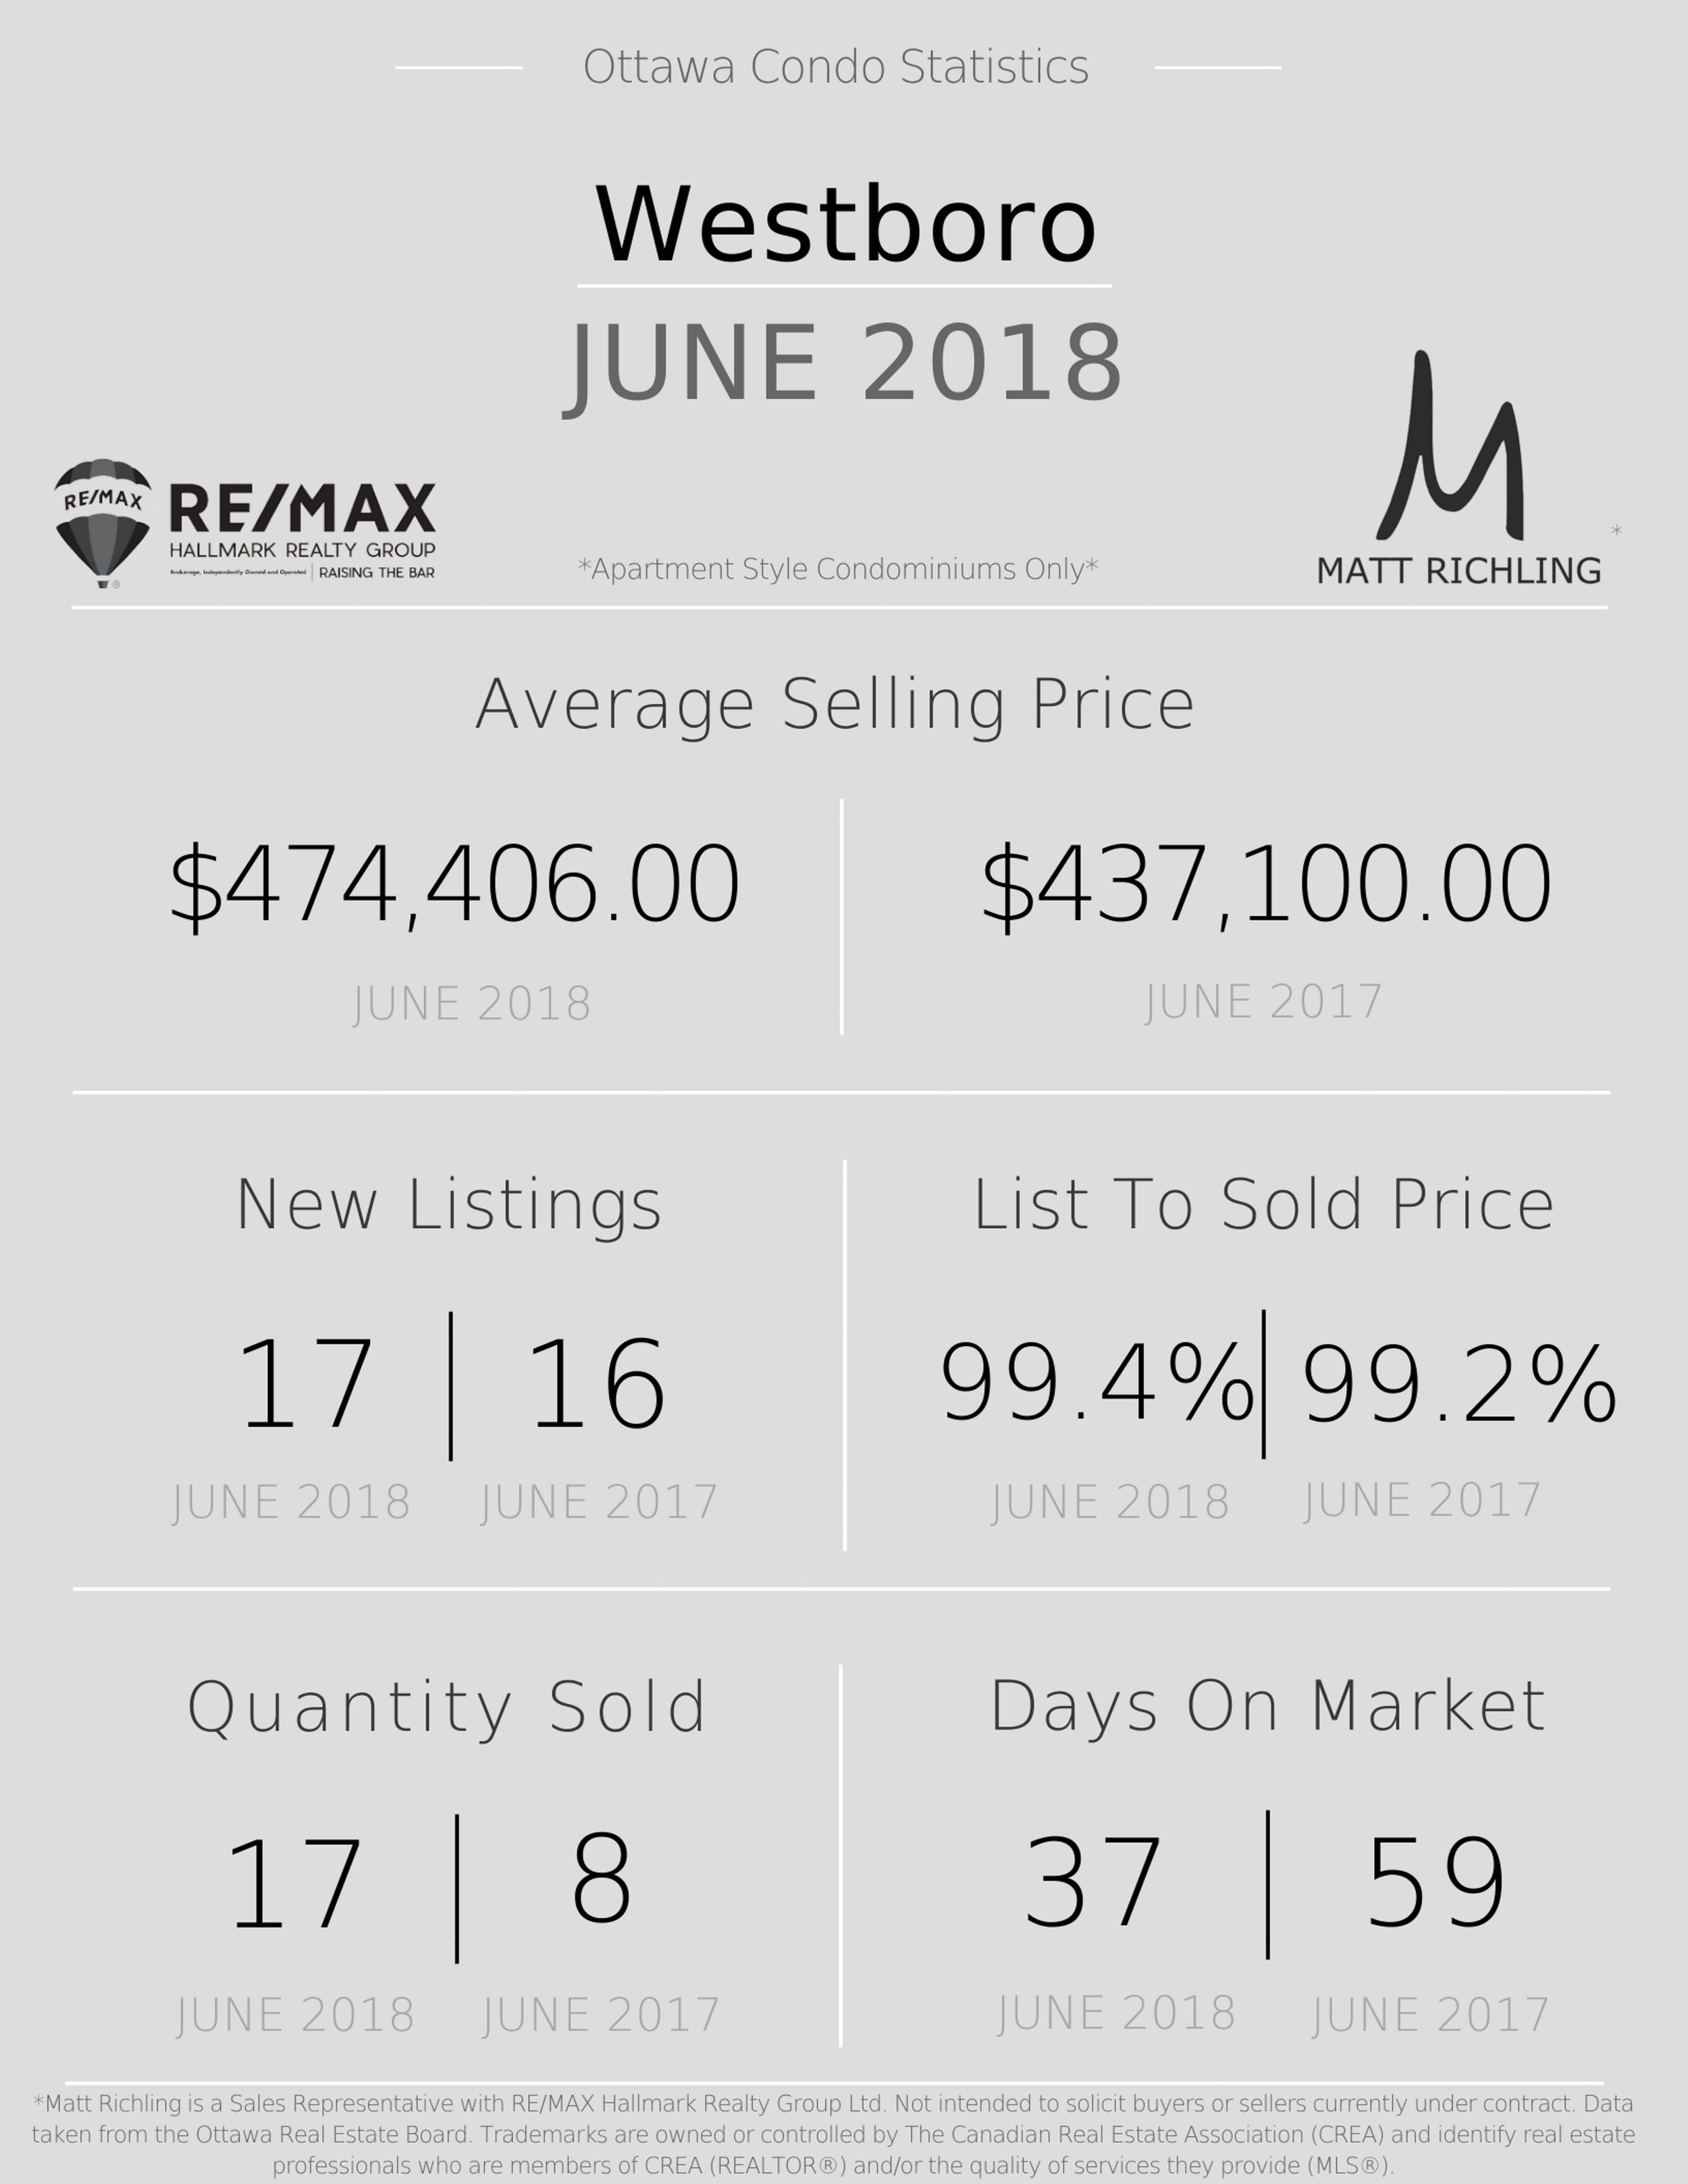
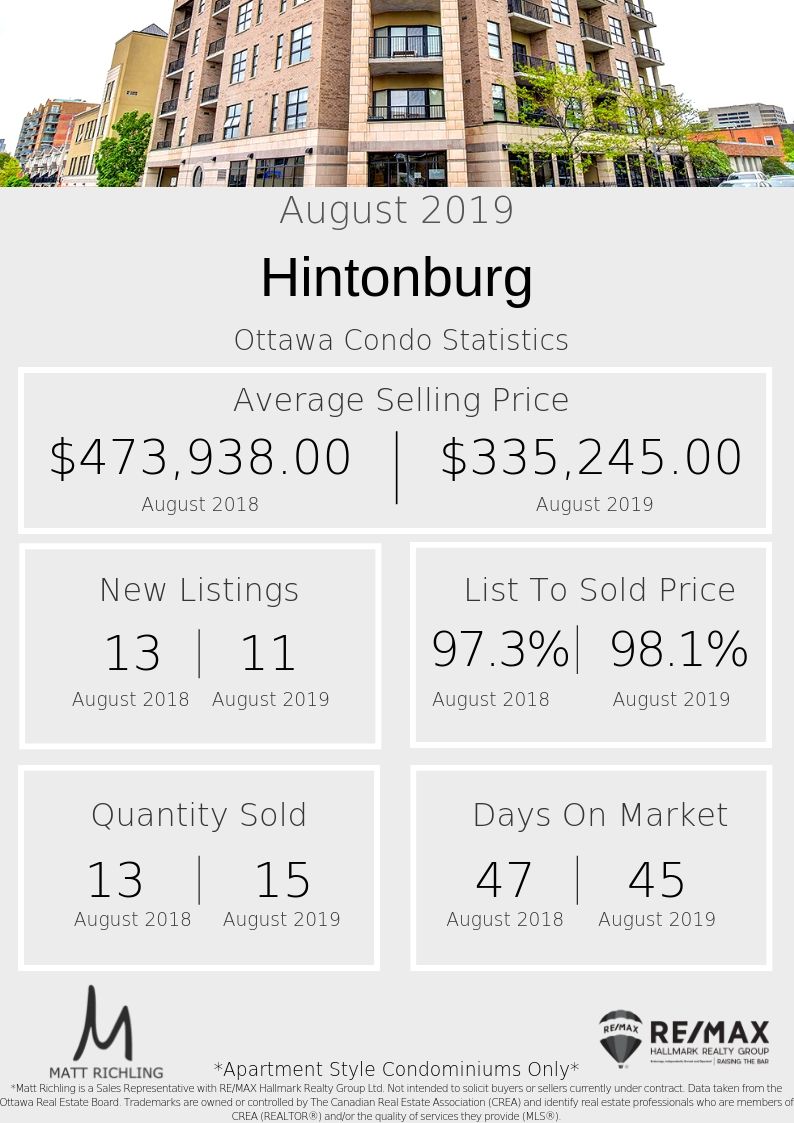
Every month we take a closer look and drill down the sales data of Ottawa condos from the previous month. Here are the statistics for August and the top five "downtown" area's - Centretown, Byward Market and Sandyhill, Little Italy (which includes Lebreton Flats), Hintonburg, and Westboro. The information will be specific to apartment style condominiums, and only what sold through the MLS. Also, DOM (Day's On Market) is calculated to include the conditional period, which in Ottawa is almost every single transaction to be roughly 14 days.


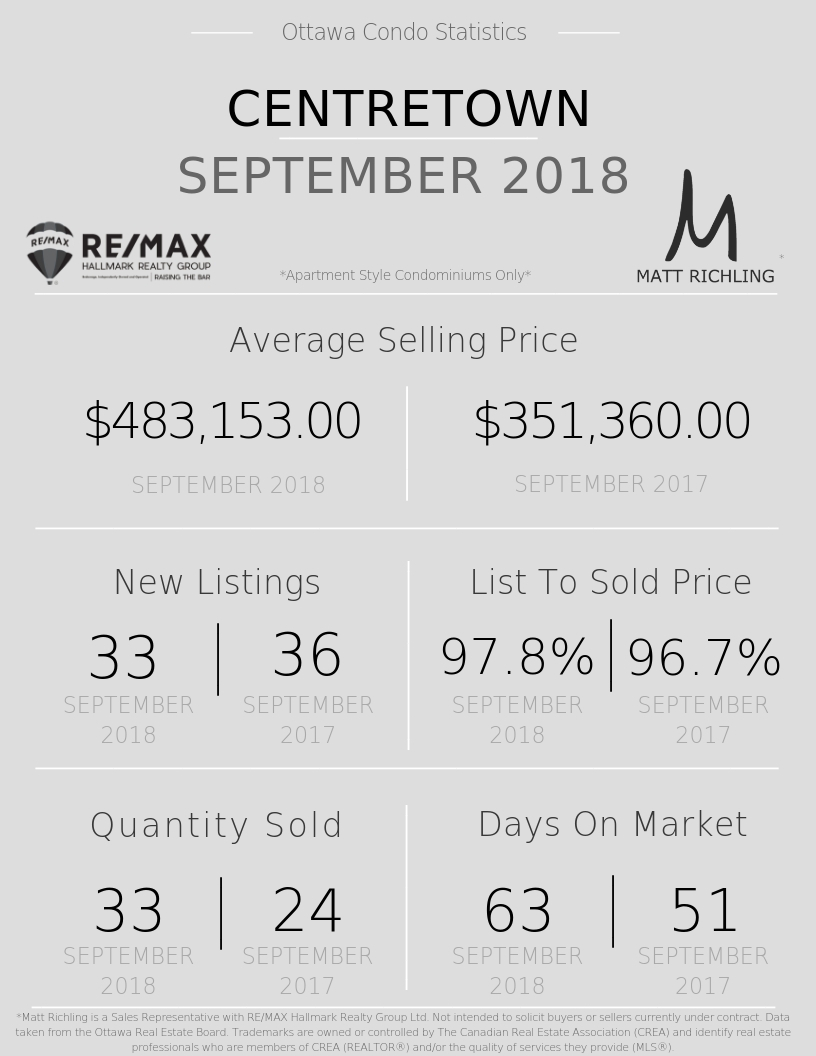
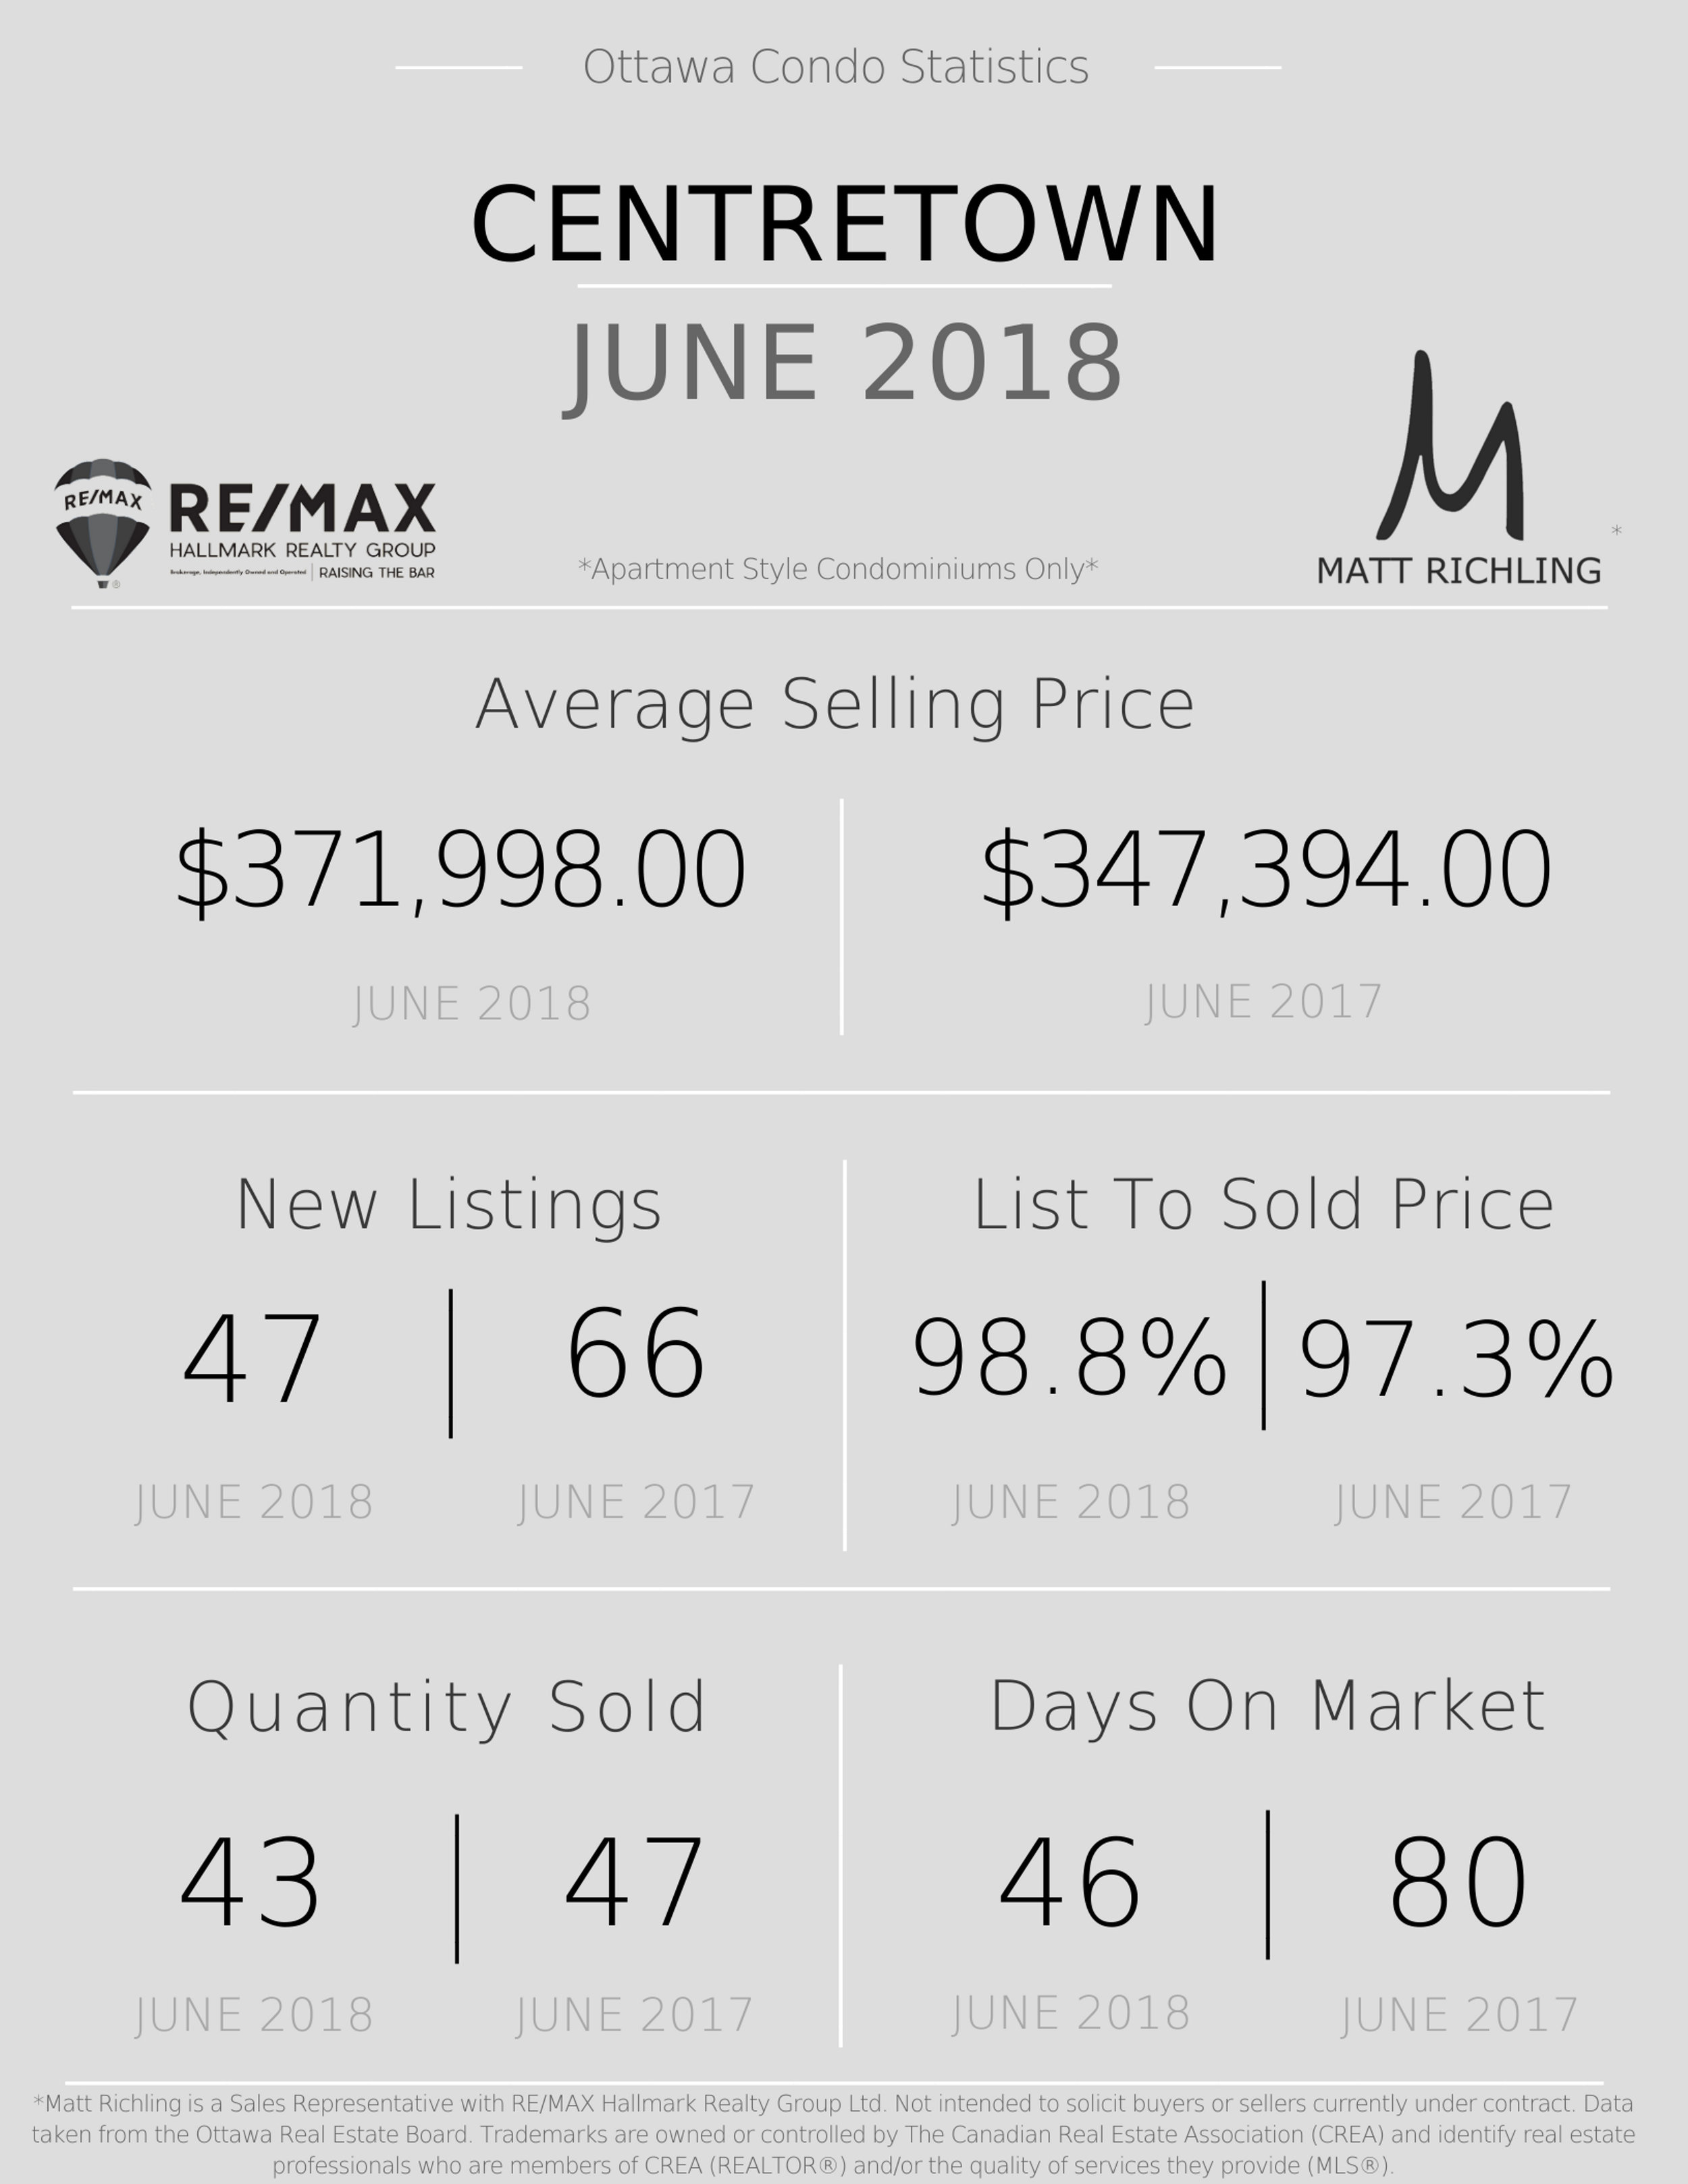
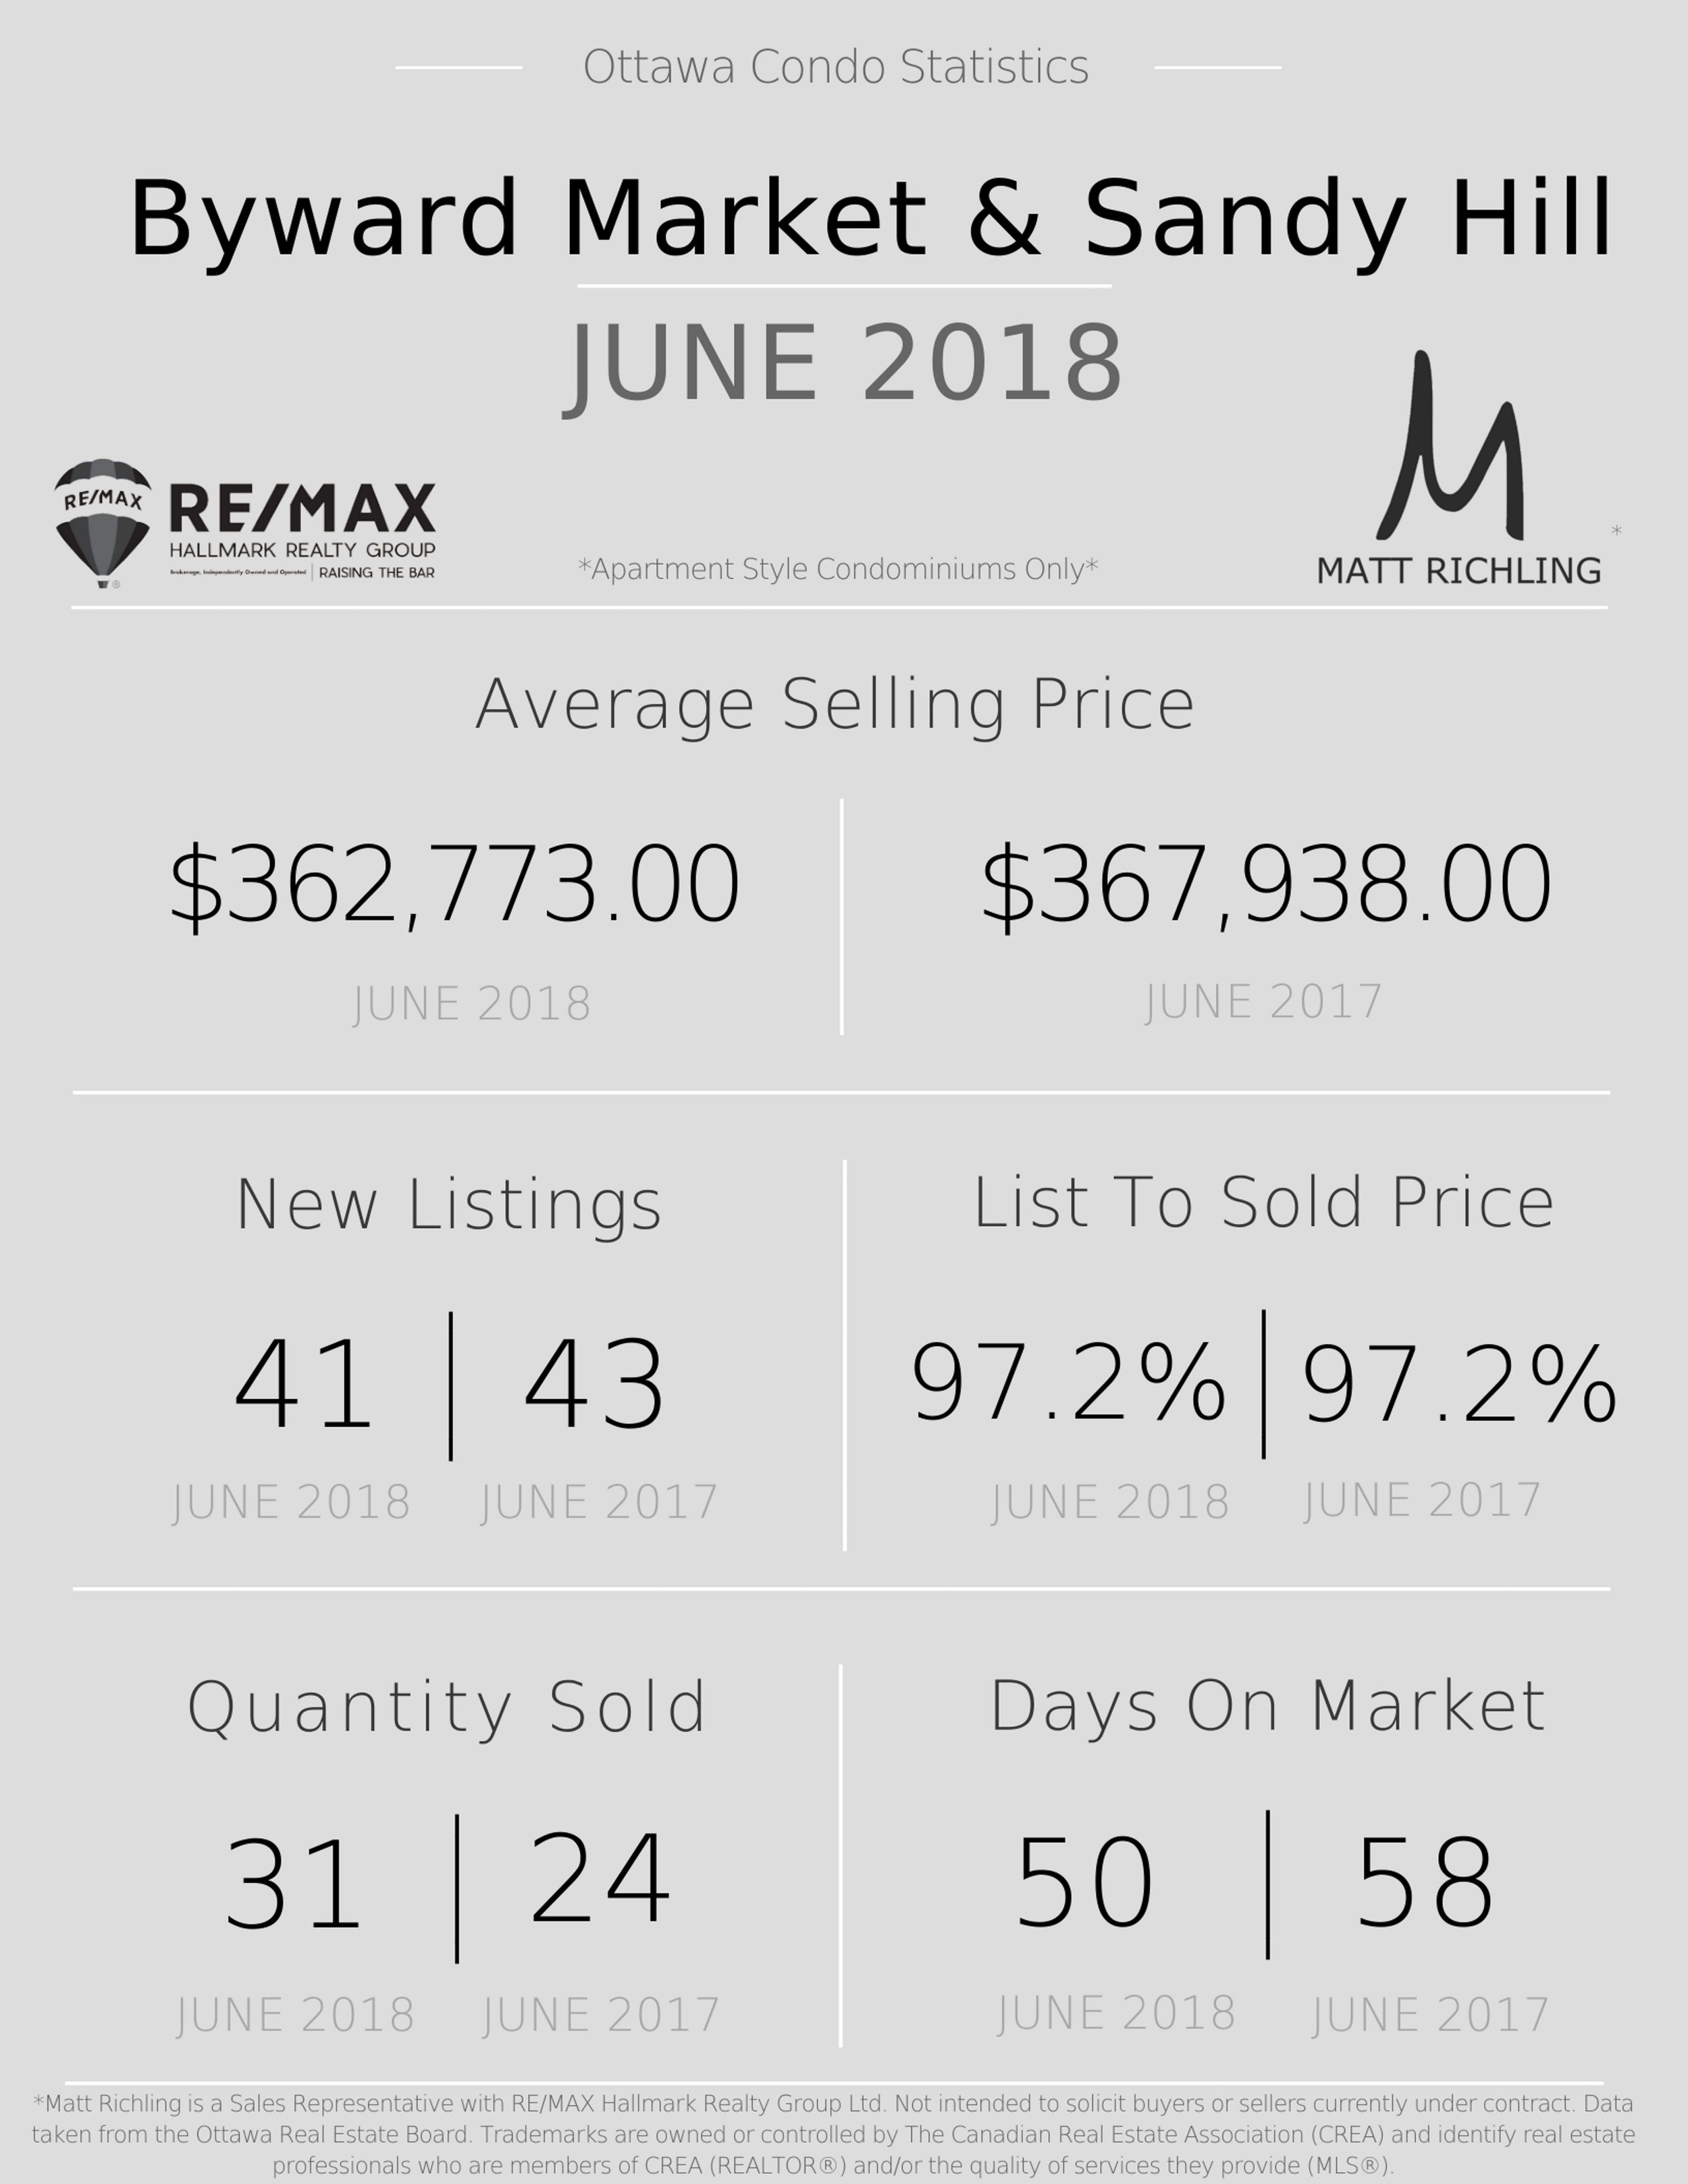
August was another busy month for condo sales in some neighbourhoods. We saw a large increase of parents coming purchasing units for their kids who are attending University. With the average rental prices jumping in the downtown core, more parents are looking at purchasing a unit as more attractive option. This fuelled the high number of sales in Centretown and Byward Market/Sandy Hill (86 sales in total). Centretown had a significant increase in average sold price, which was due to five units selling over the one million price point. Almost every neighbourhood had more units sell than new units that were listed.

If you are buying, there are still some great deals that we are seeing. Stuff that has sat on the market and not sold in multiple offers, that could be picked up at a decent price and on your terms. However if you are looking for that premium view, extra large, A++ unit, then don’t wait - pay a little extra now because everyone wants the same unit as you. Especially if you are looking at properties that fall within the First Time Home Buyers Incentive range.

If you are selling, we are placing a high importance on getting the correct pricing and spending extra time to prepare the condo for showings. Things that show well and are priced right, do not last in this market and sell for top dollar (often with multiple offers). The fall market is now here and we are expecting a hotter fall then we experienced in 2018. Especially now with the First Time Home Buyers Incentive, which will push more buyers into the market.

Centretown - Stats.jpg
Byward Market & Sandy Hill - .jpg
Little Italy - Stats.jpg
Hintonburg - Stats.jpg
Westboro - Stats.jpg

Do you have any questions about how this information affects your investment or looking for more information to make the best decision about your purchase? Let’s chat! Fill out the form on the bottom of the page.

When Is The Best Time To Sell My Ottawa Condo?

When-is-the-best-time-to-sell-condo-in-Ottawa-.jpg

Of the top questions that I get asked is regarding when is the best time of the year to sell a condo in Ottawa. While the answer will vary depending on your specific situation, let’s dive deeper into the general answers.

Most people are aware that the busiest time of the year for real estate (when most transactions take place) is the spring, followed by the fall, summer, and then the winter. This is when most listings are typically active, and when most buyers are out looking. 

However, that is generally based on the standard residential freehold buyer. Think traditional family with two kids and a dog buying a suburban home. This freehold buyer or seller is very different than the standard condominium buyer or seller in Ottawa. The freehold buyer and seller and thinking about timing the move with the kids' school year. Simply put… they want to move when it is easier for them and their family. While the majority of condominium buyers don’t have kids or even a partner to be concerned about - their lifestyle is very different. Even holidays and vacation - the condo buyer treats the holidays differently and goes on vacation differently, than the typical residential buyer. December is usually one of our busiest months with condo sales! We find that condo buyers are out with holiday parties, visiting friends/colleagues, and seeing the lifestyle that they don’t currently have. They are getting that itch to move, to upgrade.

I have a silly saying that there is “no snow in condo land”, which essentially means that condos are not affected by snow, unlike residential freehold homes. Many buyers would never buy a home in the winter - you can’t see the roof, can’t see the yard, who knows maybe there is a huge hole in the yard. While with condo’s that doesn’t affect you. Often the views in the winter are even more magical (especially at night when it is snowing). 

Location can even play a heavy role in timing. For example, usually July and August can be absolutely crazy for condo-buying that is located within walking distance to Ottawa University, Carleton University, and Algonquin College, as parents are trying to find a condo for their kid. While the freehold market is on summer break and things are usually very quiet. 

Often your situation will specify when you will need to sell. Depending on if you are up-sizing and have already purchased and need to align your moving dates. Maybe you are being transferred for work? Maybe your tenants just gave their notice, and you don’t really have the ability to sit with a vacant unit for four months trying to “time” the market. Maybe the tenants have kept the unit in very bad shape and you will need the unit vacant before listing it for sale.

Maybe you have the luxury of not needing to sell? Maybe it will depend on the market and if it is a seller's market or a buyers market? Right now in Ottawa, we are in a seller's market and for someone thinking of selling it can be prime to take advantage of the market.

When you are thinking of selling, we start by deciding who is most likely to be the purchaser of your condo. Investor? Owner-occupier? We break down the demographics for the building (age, income, sex, etc.) to help us craft possible options. A brand new 400sqft condo downtown will be a very different buyer than a 1200sqft condo that was built in 1970 located in Kanata. Not only does this help us when helping you decide when the best time to sell could be, but also how we market to that person (or groups if there could be more than one). It becomes more of a proven science than a shot in the dark without any idea of the target.

Want to chat about selling your Ottawa condo? Fill out the form at the bottom of the page.

Ottawa Condo Market Statistics - July 2019

Ottawa-Condo-Stats-and-Data.jpg

Each month we take a closer look and brake down the sales data of downtown condos from the previous month. Here are the statistics for July and the top five "downtown" area's - Centretown, Byward Market and Sandyhill, Little Italy (which includes Lebreton Flats), Hintonburg, and Westboro. The information will be specific to apartment style condominiums, and only what sold through the MLS. Also, DOM (Day's On Market) is calculated to include the conditional period, which in Ottawa is almost every single transaction to be roughly 10-14 days.

July is typically a slower month in Ottawa real estate, with everyone heading off to the cottage and enjoying the weather. Especially after a long, cold, winter like we just had! However, for most area’s the trend of low supply / seller’s market, kept it’s pace. Every neighbour hood (with the exception of Hintonburg), saw 99% list price to sale price ratio’s, and an average price over $400,000! Centretown saw the most action with 54 new listings and 46 sales. With Westboro dominating average sold price, shortest days on market, and a high list to sold price ratio, you are in a great position if you are thinking to sell. Overall, I would expect this trend to continue or let off slightly in August as we typically see, and then start picking back up in September as there are fewer cottage days, and a more normal focus on normal life.

Centretown - Stats.jpg
Byward Market & Sandy Hill - .jpg
Little Italy - Stats.jpg
Hintonburg - Stats.jpg

Do you have any questions about how this information affects your investment or looking for more information to make the best decision about your purchase? Let’s chat! Fill out the form on the bottom of the page.

Ottawa Condo Market Statistics - June 2019

Ottawa-Condo-Stats-and-Data.jpg

Each month we take a closer look and brake down the sales data of downtown condos from the previous month. Here are the statistics for June and the top five "downtown" area's - Centretown, Byward Market and Sandyhill, Little Italy (which includes Lebreton Flats), Hintonburg, and Westboro. The information will be specific to apartment style condominiums, and only what sold through the MLS. Also, DOM (Day's On Market) is calculated to include the conditional period, which in Ottawa is almost every single transaction to be roughly 10-14 days.

Wow, things keep getting hotter and hotter in the Ottawa condo market. The average selling price, days on market, list to sold price, - all keep getting more intense.

Sellers: While things are doing well for you, we are still seeing properties that don’t sell above asking, and are taking quite a while to sell. It is not as much of a sellers market as one would think. Pricing and how a unit is shown, is more important than ever. I am seeing condos listed both over and under market value (by lack of experience), and seeing condos priced correctly while also zero effort put into preparing for showings. If you had looked at selling over the last few years, but decided to put a tenant inside instead, this might be the time to review the market and data.

Buyers: Patience, preparation, and persistence. Be patient - supply is low right now and the best units will come on the market (maybe not in your price point anymore, but they will list, I promise). This isn’t a crazy sellers market. You have to be able to say no if the unit isn’t what you are looking for. Preparation - Get that mortgage pre-approval now. Know your numbers and what exactly you can afford. Being able to walk into the offer process with shorter timelines will make you stand out and give you more confidence with your offer. Persistence - Again, there is a supply shortage. The best units will come on the market, will just need to wait it out. We are also seeing more and more multiple offer scenarios, which means that you have a larger chance of loosing out if you don’t act quickly or are not prepared. If you do loose out, don’t give up!

Centretown condo stats june.jpg
Byward Market & Sandy Hill ottawa condo stats - .jpg
Little Italy ottawa condo - Stats.jpg
Hintonburg - ottawa condo June Stats.jpg
Westboro - June Condo Stats.jpg

Do you have any questions about how this information affects your investment or looking for more information to make the best decision about your purchase? Let’s chat! Fill out the form on the bottom of the page.

Ottawa Condo Market Statistics - May 2019

Ottawa-Condo-Stats-and-Data.jpg

Every month we take a closer look and brake down the sales data of downtown condos from the previous month. Here are the statistics for May and the top five "downtown" area's - Centretown, Byward Market and Sandyhill, Little Italy (which includes Lebreton Flats), Hintonburg, and Westboro. The information will be specific to apartment style condominiums, and only what sold through the MLS. Also, DOM (Day's On Market) is calculated to include the conditional period, which in Ottawa is almost every single transaction to be roughly 10-14 days.

Centretown has been a very hot month for condo sales. Over last month (April 2019) we saw the average sold price has increased, along with the number of sold units, the days on market has dropped in almost half, plus the list to sell price has tightened up, all signalling that demand for Centretown has increased, while the supply (up until this month) had not. However we have seen the supply (new listings) increase from 58 in April 2019, to 79 in May 2019. While that is not a significant number, it should certainly help buyers who are trying to get into the area. Overall it is still a very strong sellers market.

Over last month (April 2019), Byward Market and Sandy Hill, continues to improve slightly, with over $22k average selling price increase, and an extra 1.2% list to sold price (99.5% vs 98.3% in April 2019). Number of units sold, number of new listings, and days on market improves only slightly. Overall, this shows the improvement over last year. The Byward Market and Sandy Hill are still a balanced market or slightly leaning towards a sellers market.

Little Italy is still a difficult area to breakdown with such few sold units - take these numbers even more with a grain of salt. While there was very little change over last month (okay, yes average sold price increased by 18k) the one exception was the days on market jumped to 60, which was more in line with what we were seeing in 2018. We are still seeing fewer listings on the market, which is helping to keep the list to sold price at a very tight 99%. With such little supply in Little Italy, the hot properties will sell quick and for a very strong price.

Same as Little Italy, these Hintonburg condo stats need to be taken with a grain of salt due to the low volume of sold units. We are starting to see the days on market rise, along with the amount of new listings to match what we saw last year at this time. However in perspective to other neighbourhoods in Ottawa, the days on market is still quite low, and with a higher list to sold price it is still clear that it is a sellers market in Hintonburg. If we saw more supply hitting the market, then we might see things balancing out in more favour for a buyer.

The Westboro condo market has continued to improve with only four new condos adding to the supply. The days on market is the lowest in the city, with the highest list to sold price (tied with Byward Market and Sandy Hill). This is certainly a sellers market and we will need a large number of new listings to help balance it out.

Do you have any questions about how this information affects your investment or looking for more information to make the best decision about your purchase? Let’s chat! Fill out the form on the bottom of the page.

Ottawa Condo Market Statistics - April 2019

Ottawa-Condo-Stats-and-Data.jpg

Every month we take a closer look and brake down the sales data of downtown condos from the previous month. Here are the statistics for April 2019 and the top five "downtown" area's - Centretown, Byward Market and Sandyhill, Little Italy (which includes Lebreton Flats), Hintonburg, and Westboro. The information will be specific to apartment style condominiums, and only what sold through the MLS. Also, DOM (Day's On Market) is calculated to include the conditional period, which in Ottawa is almost every single transaction to be roughly 10-14 days.

Little Italy - Stats.jpg
Westboro - Stats.jpg

Do you have any questions about how this information affects your investment or looking for more information to make the best decision about your purchase? Let’s chat! Fill out the form on the bottom of the page.

Ottawa Condo Market Statistics - March 2019

Ottawa-Condo-Stats-and-Data.jpg

Every month we take a closer look and brake down the sales data of downtown condos from the previous month. Here are the statistics for March 2019 and the top five "downtown" area's - Centretown, Byward Market and Sandyhill, Little Italy (which includes Lebreton Flats), Hintonburg, and Westboro. The information will be specific to apartment style condominiums, and only what sold through the MLS. Also, DOM (Day's On Market) is calculated to include the conditional period, which in Ottawa is almost every single transaction to be roughly 10-14 days.

Centretown - Stats (1).jpg
Byward Market & Sandy Hill -  (2).jpg
Little Italy - Stats (2).jpg
Hintonburg - Stats (1).jpg
Westboro - Stats (2).jpg

Do you have any questions about how this information affects your investment or looking for more information to make the best decision about your purchase? Let’s chat! Fill out the form on the bottom of the page.

Ottawa Condo Market Statistics - February 2019

Ottawa-Condo-Stats-and-Data.jpg

As we do every month, we have taken a closer look and broken down the sales data for the month of February 2019 for the top five "downtown" area's - Centretown, Byward Market and Sandyhill, Little Italy (which includes Lebreton Flats), Hintonburg, and Westboro. The information will be specific to apartment style condominiums, and only what sold through the MLS. Also, DOM (Day's On Market) is calculated to include the conditional period, which in Ottawa is almost every single transaction to be roughly 10-14 days.

Ottawa Condo Centretown - Statistics February.jpg
Byward Market & Sandy Hill - February.jpg
Little Italy - Stats.jpg
Hintonburg - Stats.jpg
Westboro - Stats.jpg

Do you have any questions about how this information affects your investment or looking for more information to make the best decision? Let’s chat! Fill out the form on the bottom of the page.

Ottawa Condo Market Statistics - January 2019

Ottawa-Condo-Stats-and-Data.jpg

As we do every month, we have taken a closer look and broken down the sales data for the month of December 2018 for the top five "downtown" area's - Centretown, Byward Market and Sandyhill, Little Italy (which includes Lebreton Flats), Hintonburg, and Westboro. The information will be specific to apartment style condominiums, and only what sold through the MLS. Also, DOM (Day's On Market) is calculated to include the conditional period, which in Ottawa is almost every single transaction to be roughly 10-14 days.

Ottawa Condo Centretown - Statistics January.jpg
Ottawa Byward Market & Sandy Hill Condo - Stats January 19.jpg
Ottawa Condo Little Italy - Stats January 2019.jpg
Ottawa Condo Hintonburg - Stats January 2019.jpg
Westboro Condo Ottawa - Stats January 2019.jpg

Do you have any questions about how this information affects your investment or looking for more information to make the best decision? Let’s chat! Fill out the form on the bottom of the page.

Ottawa Condo Market Statistics - December 2018

Ottawa-Condo-Stats-and-Data.jpg

As we do every month, we have taken a closer look and broken down the sales data for the month of December 2018 for the top five "downtown" area's - Centretown, Byward Market and Sandyhill, Little Italy (which includes Lebreton Flats), Hintonburg, and Westboro. The information will be specific to apartment style condominiums, and only what sold through the MLS. Also, DOM (Day's On Market) is calculated to include the conditional period, which in Ottawa is almost every single transaction to be roughly 10-14 days.

Market - Centretown.jpg
Market - Byward Market and Sandy Hill.jpg
Market - Little Italy.jpg
Market - Hintonburg.jpg
Market - Westboro.jpg

Questions about how these numbers affect your investment/condo? Let’s chat! Fill out the form on the bottom of the page.

Ottawa Condo Market Statistics - November 2018

Ottawa-Condo-Stats-and-Data.jpg

As we do every month, we have taken a closer look and broken down the sales data for the month of November 2018 for the top five "downtown" area's - Centretown, Byward Market and Sandyhill, Little Italy (which includes Lebreton Flats), Hintonburg, and Westboro. The information will be specific to apartment style condominiums, and only what sold through the MLS. Also, DOM (Day's On Market) is calculated to include the conditional period which in Ottawa is almost every single transaction to be roughly 10-14 days.


Ottawa condo real estate statistics Centretown.jpg
Market - Byward Market and Sandy Hill.jpg
Market - Little Italy.jpg
Market - Hintonburg.jpg
Market - Westboro.jpg

Questions about how these numbers affect your investment/condo? Contact us to chat more!

Ottawa Condo Market Statistics - October 2018

Ottawa-Condo-Stats-and-Data.jpg

Each month we take a closer look at the previous monthly condo sales data for the top five "downtown" Ottawa area's - Centretown, Byward Market and Sandyhill, Little Italy (which includes Lebretown Flats), Hintonburg, and Westboro. The information will be specific to apartment style condominiums, and only what sold through the MLS. Also, DOM (Day's On Market) is calculated to include the conditional period which in Ottawa is almost every single transaction to be roughly 10-14 days. Questions?


Market - Centretown.jpg
Market - Byward Market and Sandy Hill.jpg
Market - Little Italy.jpg
Market - Hintonburg.jpg
Market - Westboro.jpg

Questions? Want to know how it affects your condo? Fill out the form below and let’s chat.

Ottawa Condo Market Statistics - September 2018

Ottawa-Condo-Stats-and-Data.jpg

Every month we take a closer look at the sales data for the previous month for the top five "downtown" area's - Centretown, Byward Market and Sandyhill, Little Italy (which includes Lebretown Flats), Hintonburg, and Westboro. The information will be specific to apartment style condominiums, and only what sold through the MLS. Also, DOM (Day's On Market) is calculated to include the conditional period which in Ottawa is almost every single transaction to be roughly 10-14 days. Questions?


CENTRETOWN

Market - Centretown.jpg

Huge jump in the average selling price for Centretown condos this year compared to September of 2017. Part of the reason for the large jump was due to a number of sales over the $500k mark. Over last month, we saw a similar number of new listings, while we saw quite a few more properties sell (33 vs 24). The list to sold price ratio stayed about the same, with the days on market increasing slightly (63 vs 51).


BYWARD MARKET AND SANDY HILL
(INCLUDES LOWERTOWN)

Market - Byward Market and Sandy Hill.jpg

Compared to last month, the Byward Market saw a healthy jump in average sold price with the number of sold condo units fell over last month (16 vs 24). Other than the differences in sold price, September of 2018 is pretty much the same as last year.


LITTLE ITALY
(INCLUDING LEBRETON FLATS)

Market - Little Italy.jpg

Little Italy continues to see fewer sales compared to new listings which is great if you are a buyer looking to enter. The average selling price is up over last month (362,330) and last year (329,086). Take the sold data with a grain of salt, since there is only a few sales to provide an average.


HINTONBURG

Market - Hintonburg.jpg

Hintonburg continues to be an area with healthy demand and very few options for buyers. Lots of older product with very few modern buildings that continue to cause havoc on the numbers. Like last month, we saw the same amount of new listings that ended up selling, providing no increase or decrease to number of available product. With that, the DOM and list to sold price continue to weaken. We are seeing first hand that nice product that is priced right will sell quick!


Westboro

Market - Westboro.jpg

Westboro continues to stay in great shape with one of the highest average selling prices. The DOM tightened up over last month, however we saw more activity which brought the other numbers more in line with what we are seeing across the city.


Looking for specific information about an Ottawa condo building or area? Thinking of buying and maximizing your dollar? Let's chat. Fill out the form below.

Ottawa Condo Market Statistics - August 2018

Ottawa-Condo-Stats-and-Data.jpg

We have taken a closer look at the sales data for the month of August 2018 for the top five "downtown" area's - Centretown, Byward Market and Sandyhill, Little Italy (which includes Lebretown Flats), Hintonburg, and Westboro. The information will be specific to apartment style condominiums, and only what sold through the MLS. Also, DOM (Day's On Market) is calculated to include the conditional period which in Ottawa is almost every single transaction to be roughly 10-14 days.


CENTRETOWN

Ottawa Condo Market Statistics Centretown

The market in Centretown slowed down over the month of August as most buyers and sellers are typically traveling or enjoying the summer before heading back to work. Compared to last month, (July 2018 stats) we saw our average selling price drop from $371,512 to $358,201, and only 32 new listings to July's 48. List to Sold prices came back to along what it was last year. 

What does this mean? While you could argue things slowed down, the lack of demand (fewer buyers) showed its head, and unless we see an increase in new listings in September, the DOM and list to sale price ratio will tighten up as there will be less to buy. We saw a more balanced market in August.


BYWARD MARKET AND SANDY HILL
(INCLUDES LOWERTOWN)

Market - Byward Market and Sandy Hill.jpg

Compared to July, we saw a $90,000 reduction in average sale price, fewer days on market, and a tighter list to sold price. In August we saw an equal amount of new listings to sold listings.

What does this mean? There was a higher demand for lower priced properties, and a strong pull from investors looking in that sub 300k market. The low amount of new listings, shorter days on market, and higher list to sold price ratio means things can easily jump in September unless we see more product come on the market. A sellers market below $300k, and a buyers market above $300k.


Little Italy
(INCLUDING LEBRETON FLATS)

Market - Little Italy.jpg

The seven sales in July were hot, which is evident in the 99.7% average list to sold price and the 35 average days on market. The average selling price dropped, which needs to be taken with a grain of salt since we have such low number of data points.

What does this mean? The properties that sold, were priced well and hot for the buyers looking. Its a buyers market, unless you are looking at one of the hot listings. Last month saw 14 new listings with only 4 sold. 


HINTONBURG

Market - Hintonburg.jpg

Looking at the differences over last year might give you a scare - however with such few data points, you need to understand it is not a perfect example and rather use trends to better understand the market. We saw more new listings and more sales this month than last month. The days on market stayed the same, and the average selling price dropped. Other than price, things have certainly improved over last year!

What does this mean? As with other areas, the amount of sales below the 300k continue to dominate. The market has certainly improved over last year, and I would be willing to bet that next month you will see the selling price jump back up. The lower DOM over last year still signifies that more buyers are looking here than before, and would be a good time to sell!


WESTBORO

Market - Westboro.jpg

Like last month, Westboro continues to be one of the hot markets with high prices and low inventory. A very tight List to Sold Price ratio and such few new listings makes this a unique market when you see the high DOM. The right properties are selling for close to ask, but taking longer. I would be willing to bet that September will see DOM drop.


Looking for specific information about a building or area? Thinking of buying and maximizing your dollar? Let's chat. Fill out the form below.

Ottawa Condo Market Statistics - July 2018

Ottawa-Condo-Stats-and-Data.jpg

Let's break down some specific data for the month of July for the top five "downtown" area's - specifically Centretown (including Golden Triangle), Byward Market and Sandyhill, Little Italy (which would include Lebreton Flats),  Hintonburg, and Westboro. The information will be specific to apartment style condominiums, and only what sold through the MLS. Also, DOM (Day's On Market) is calculated to include the conditional period which in Ottawa is almost every single transaction to be roughly 10-14 days.


Centretown

Ottawa Condo Market - Statistics Centretown.jpg

The market in Centretown continued to tighten for July which is noticeable in the higher list to sold price ratio of 99.1% compared to 98.8% (from last month) and the fewer days on market of 43 compared to 46 (from last month). We still have a similar amount of new listings as last month, however the amount of units that sold have dropped from 43 (June) to 29 (July). Prices are up compared to last year, however holding about the same as last month.

What does this mean? While things have tightened up, the numbers would show that there is going to be more units available going into August. This might ease up the DOM, Sold Price Ratio, or the average sold price - more supply with equal or less demand.... Could be seeing a shift to a more buyer focused market.


Byward Market and Sandy Hill
(Includes Lowertown)

Condo Market Statistics Ottawa - Byward Market and Sandy Hill.jpg

Compared to last month we have seen similar numbers except for two. The average price has jumped from $362,773 in June 2018, to $410,517 for July 2018. Keep in mind that in May 2018 it was almost $400k, so the large change is expected and due to the few number of data points that are used can vary the number. At the same time, the days on market has increased from 50 last month, to 84 this month. Note - the DOM hit 162 days back in January of 2016.

What does this mean? With the DOM jumping up to 84 days, yet amount of new and sold listings staying almost the same as last month, we would expect the price to come back down or the list to sold price ratio to drop. Still continues to be more of a buyers market, especially with the higher DOM, lower LTS price ratio, etc. 


Little Italy
(Including Lebreton Flats)

Market - Little Italy.jpg

Average price has jumped over last month (June 2018) to $395,175. However that is based on the only four sales that happened this month. We continue to see more new listings, and fewer sales. DOM has increased to 50 days and the LTSP ratio has nudged up to almost 98.9%. 

What does this mean? A buyers market. Higher DOM, more options (listings), etc. With only four sold it means you have less competition. However the high LTSP ratio says that for the sellers who are serious, and priced right, you can and will sell.


Hintonburg

Ottawa Condo Market - Hintonburg.jpg

The average sold price has dropped to $318,173, when it was $374,620 last month (June 2018). Activity has dropped (both new and sold listings), and the LTSP ratio edged up slightly. 

What does this mean? More of a sellers market. With fewer units available overall, a higher sold price ratio, and a somewhat low DOM, It would be a good time to sell. Buyers will want to see more supply, or need to be quick on their feet for the best units.


Westboro

Market - Westboro.jpg

The average price is up over last month, but down over this time last year. Less activity then last month, but similar ratio of new vs sold units. Same LTSP ratio as last month with DOM increasing slightly. 

What does this mean? Sellers market. Highest average price, and highest LTSP ratio, along with the similar ratio of new vs sold listings, make it a very difficult buyers market. Not much negotiating is going on. Chances of multiple offers are strong. Again, the higher price point is due mainly to the larger, longer planned living (compared to the studio and sub 600sqft units in Centretown etc.).


Looking for specific information about a building or area? Thinking of selling and want to get the best return? Let's chat. Fill out the form below.

Ottawa Condo Market Statistics - June 2018

Ottawa-Condo-Stats-and-Data.jpg

Often, real estate is defined by its numbers and data - we can report on "hard facts" to provide a picture of the market. However, when we receive the standard monthly updates from the Ottawa Real Estate Board, I find it quite frustrating that the data reported for "condominiums" is board wide - meaning any property type that was listed as a condominium in any area. (This isn't a rant - there are too many micro markets across the city for them to report). What this means is that the information isn't compared by location (downtown vs Kanata) or property type (example - apartment or townhome) which can often mask or hide very interesting or specific information on a more detailed level. We all (should) know that there is a huge difference in price between a townhouse style condo in Kanata, versus a modern downtown highrise apartment in Centretown. 

Let's break down some specific data for the top five "downtown" area's - specifically Centretown (including Golden Triangle), Byward Market and Sandyhill, Little Italy (which would include Lebreton Flats),  Hintonburg, and Westboro. The information will be specific to apartment style condominiums, and only what sold through the MLS. Also, DOM (Day's On Market) is calculated to include the conditional period which in Ottawa is almost every single transaction to be roughly 10-14 days.


Centretown
(North of 417, Canal to the East, Bronson to the West, Parliament Hill to the North).

Ottawa Condo Market Stats June 2018 Centretown 2.jpg

Overall the average sold price for a Centretown condo over the last month is $371,998.00 which is up compared to a year ago, which saw an average list price of $347,394.00. The average DOM is at 46 which is an improvement over last year at 80 days (Keep in mind that includes the conditional period). The list to sale price ratio has increased to just under 99%, and a nice increase over last year at just above 97%. In June, we saw only 47 new listings, with 43 sales.

What does it mean? A healthy increase in the demand for condos located in Centertown. A much more balanced market, with prices continuing to rise at a very marginal rate. One thing to note is that the DOM from two years ago was up to a whopping 85 days. Based on what was listed vs sold, I would expect the market to be more of a Seller's market unless we see more listings!


Byward Market and Sandy Hill
(Includes Lowertown)

Ottawa Condo Statistics - Byward Market and Sandy Hill 2 .jpg

The average sold price this month in the Byward Market and Sandy Hill has dropped slightly to $362,773. The DOM has dropped to 50 days, and much better than it was 3 years ago - 75 days. The list to sale price ratio held the same around the low 97%.

What does this mean? Prices are lower and becoming more attractive to buyers which is helping to reduce the DOM. Slightly more leaning towards a buyers market then for selling. With the DOM lowering you should see the list to sale price ratio increase.


Little Italy
(Includes Lebreton Flats)

Ottawa Condo Market Statistics - Little Italy 2 .jpg

The average sold price for a condo in Little Italy is down to $386,900. The average DOM is up to 47 days, with the one year at 45 days. The average list to sold price ratio is up to 98.1%. Overall there are less new listings with a few more sales compared to last year.

What does this mean?  Since there are fewer buildings which mean fewer sales, the numbers will be affected more by each sale. Lower prices will drive the DOM and sale price ratios as buyers compare them to other areas. The number of listings will increase, and as prices drop, the number of sales will increase. Great market if you are a buyer looking for options with less competition.


Hintonburg

Ottawa Condo Market Statistics - Hintonburg.jpg

The average sold price in Hintonburg lowered slightly from last year, to $374,620. More sales and a much tighter list to sold price ratio have dropped the DOM to less than half - now 39 days from the 89 days a year ago. 

What does this mean? It is much more of a seller's market than a buyer's market. I think it will get tighter unless we see more listings. More buyers looking to move more west! It is a great time to sell.


Westboro

Ottawa Condo Market - Westboro Statistics.jpg

The average sale price in Westboro is up from last year to $474,406. With 17 new listings and 17 sold properties. The highest list to sold price ratio in any of the five area's at 99.4%! The DOM is also quite low at 37!

What does this mean? A hard market if you are a buyer. Considering that almost all condos will sell with a conditional period for status certificate review of 10-14 days, the DOM of 37 is very good for sellers.  The higher price point is due mainly to larger, longer term planned living (compared to studio's and sub 600sqft units found more in Centretown and Byward Market). 

Are you looking for more information about a specific area or building? Thinking of selling or buying? Let's chat - click on the button below!

Ottawa Condo Market Stats for January 2018

2018CondoMarketHeader.jpg

Let's take a quick look at the numbers for the Ottawa condo market for January 2018 and how they stack up. ** Note: All data is provided by the Ottawa Real Estate Board. Condo data includes all condominium property styles.**

- There were 406 new condo listings to come on the market in January 2018, a decrease compared to January 2017 which saw 472.

- The average condo sale price was $263,744, a decrease from January 2017 by 8.6%

- There were 173 sales, an increase of 45% over January 2017 which only had 119

- 55% of the sales were priced between $150,000 and $249,999

- Active listings at the end of January 2018 compared to end of January 2017 saw a decrease of 27.2%... meaning there were 27.2% less available units at the end of January this year than last year. 

While we saw the average price decrease, it was mainly due to a lack of sales in the higher price point and more sales in the lower range. At the same time, we saw an increase in sales overall which leads to a lack of supply compared to the same time last year. Bottom line .... This is setting up for a crazier market this spring!

If you are thinking of selling, this is the time to get things started and listed. Less competition means a hungrier buyer! Email or call and we can chat about options and your specific unit.

2018 Ottawa Condo Market - Predictions

2018CondoMarketHeader.jpg

Last year I suggested that if you were to ask ten strangers about the Ottawa condo market you would likely get a pretty constant message that the market wasn't very pretty. Keep in mind it has been a rough number of years since things were booming. However, if you were to ask another ten people this year, I would say the responses are going to be less confusing and more focused. 

Since the 2017 Market report, things have certainly increased and we are seeing the condo market pick up. There are fewer listings and fewer DOM (days on market) than in past years. Buildings that had high numbers of listings, only have a couple (if that). The question could be asked if this is due to less supply of units or seller's pricing more realistically and selling. We are constantly seeing multiple offers on condos - again, is it due to lack of supply or more accurate pricing, or both? While the market is not red hot it is certainly better than in previous years. 

All of this while the government is placing more rules and regulations to calm the markets in large urban centers (Toronto etc.). While it will still be interesting to see how the most recent mortgage changes will affect the market - it is too early to tell but most anlysts are agreeing it will have little to no impact on the market especially in Ottawa.

CMHC is predicting that housing starts (new construction) in Ottawa will decline over 2018 and 2019 caused by a drop in apartment (condominium) starts (not freehold housing). This will continue to strengthen the demand for resale or existing homes, especially due to Ottawa's relative affordability. This affordability factor will also help to push up the price of Ottawa resale properties.

What to expect for the 2018 Ottawa condo market?
- A positive condo market. Slightly improved over the 2017 market but not as large of a change as was expected. This means much more balanced, or slightly more in favour of the seller. 

- Slightly increased sales numbers to last year with a modest increase in price. Building off of 2017 and continuing to see growth.

- More units sold to buyers located outside of Ottawa. Parents purchasing for kids while at school,  investors from Toronto, etc. Ottawa has a huge leg up in comparison to other cities when it comes to affordability. We will see more units purchased as investments since the "Ottawa real estate dollar" goes further. Add in the relatively slow and constant growth, it is seen as a safer investment than Toronto or Vancouver. 

- Tighter regulations in condo buildings for short-term accommodations (Airbnb) and more freehold units converted to supply the demand. There is a lot of money in short term rentals, and there is no shortage of people looking for it. 

- First-time buyers using more family money/credit. Borrowing from the bank of mom and dad will be more popular due to the changes in mortgage requirements. As well as parents being on title - to increase the ability for the child to qualify.

- Little impact from the Mortgage Stress Test. Due to Ottawa's lower average price point, the mortgage stress test will affect fewer buyers than in larger urban centers where the average price is much higher.

- More demand for units closer to downtown. The city of Ottawa has a huge push to calm traffic. This includes removing secondary lanes, increasing "no right turn on reds", increasing the number of bike lanes, advanced pedestrian walk at lights, etc. The goal is to make the streets safer - which is great. However, this is going to see an increase in the time it takes to get to and from work. This will also push commercial development in areas outside of downtown. 

- Messy period around marijuana regulations with landlords/tenants and condo boards. As well, what constitutes a grow-op and personal use with regards to disclosure when selling.

Thoughts? It is going to be an interesting year and I am looking forward to it! Bring it on.

Agree/disagree? Tell me below.

2017 Ottawa Condo Market - Predictions

2017 Ottawa Condo Market

If you ask ten strangers about the Ottawa condo market right now, you are likely to get a pretty general idea of how things are currently going. Not great, slow, crap, etc. Unlike it's sister market - freehold homes are selling quite well and are still breaking monthly sales numbers. Condo's on the other hand, are not so hot. Let's take a quick look back and then see where things are possibly headed.

The condo market has been in this "slump" since 2012 when supply/demand started catching up. We started noticing the number of listings and DOM (days on market) increasing, and fewer multiple offers etc. Over the last few years, the conversation when sitting down with someone looking to sell is often about how to loose as little as possible, or even how to break even. Now keep in mind there are a few factors in play here. Most of these people bought in 2009-2013 (or earlier) and expected the market to keep going the path that it was. At that time, who cared if the view was horrible, upgrades were slim, or they over paid.... it would still be worth more when they sold. As well, many times the condo that was purchased does not fit their current lifestyle (partner/pet/baby/clothes addiction), and after only a few years they are looking to sell. That person has not stayed in the unit long enough to really see the value rise. 

Where are we right now? Well in 2016, the number of unsold units dropped by almost a fourth from November to February (529 vs 699). Builder condo starts (number of permits etc.) from the first 11 months of 2016 were 583. Down from 776 for the same period in 2015, and down significantly from 1301 in the same 11 month stretch in 2014. Less builder starts mean less supply and allows everything to even out (typically 2-3 years). Right now, we still have buildings on the way but more builders are focusing on the hot rental market. Switching poor selling or upcoming projects to rental buildings. Housing affordability really hasn't changed - its still an issue overall, however new first-time buyer credits and low-interest rates still make purchasing attractive (if you can afford it). 

Is the market right now really that bad? The fall market saw numerous multiple offers... (yes, you read that correct), and short days on market (3-4 days, 7 days etc). We had this first hand and couldn't believe it. One of my Centretown listings in the fall had multiple offers (five in fact!) and the property sold over list price. So, no... the condo market in Ottawa is certainly not horrible. It just depends on numbers and who you're talking to.

What should we expect for 2017? Based on the numbers and market, I expect a better condo market overall for 2017. Not a crazy difference, but it will feel better or more positive than 2014/2015/2016, leading the way for a larger change in 2018. 
- A positive condo market.
- Similar sales numbers, but with a modest 1-3% increase in price.
- Sellers spending more to prepare the unit before selling. Painting, decluttering, even staging. All in an effort to maximize the value and shorten the time it takes to sell.
- Fewer high rise condos selling for investment. The 2015/2016 built condo's are all seeing the condo fee rise and the numbers are harder and harder to make work. However you will still see it, being more hands-off and easier to handle makes them perfect for out of city owners, or new first time investors.
- No units purchased for airbnb. This will move to centrally located freehold housing with less rules and restrictions. If a building didn't restrict short term rentals in 2016, it will in 2017.
 - Buyers will spend more time to decide before making a purchase. There is more information and reviews online about buildings and the builder. Buyers will (or should - see below) look closer at the building and unit before they place an offer.
- First-time buyers looking at slightly larger units. Even if that means waiting to afford them. They will learn from the mistakes of those selling now.

Keep in mind there is a lot going on with respect to United States, which could impact all of this. These are my perdictions. Thoughts?

Genworth's Metropolitan Condo Outlook - Winter 2015

Screen Shot 2015-03-27 at 3.25.52 PM.png

Genworth and the Conference Board of Canada has released the 2015 winter edition of its apartment condominium study that looks at eight metropolitan areas, including Ottawa.

For the full report and in depth look into Ottawa and the other areas, click here.

"Although inventories remained high in 2014, Ottawa apartment building permits nearly doubled during the six months to December 2014 compared with their year-earlier levels. As a result, the new apartment condominium market is set to pick up again in 2015, with starts forecast to increase by 9.9 per cent. In fact, construction is already under way on a number of new buildings this year, including The Bowery condominiums and Claridge’s Icon condominiums in Little Italy. The Icon condominium building will be Ottawa’s tallest. But this title may not last long. A new development proposed by Richcraft Homes, also in the Little Italy neighbourhood, would see the construction of three new towers, the biggest of which would be 55 storeys tall. Starts are expected to keep rising from 2016 to 2019, growing by a forecast average of 1.2 per cent per year. Absorptions are set to decline this year and next, albeit from a 2014 record high, and then begin to rise through the next few years, helping to whittle down inventories." - taken from the report.