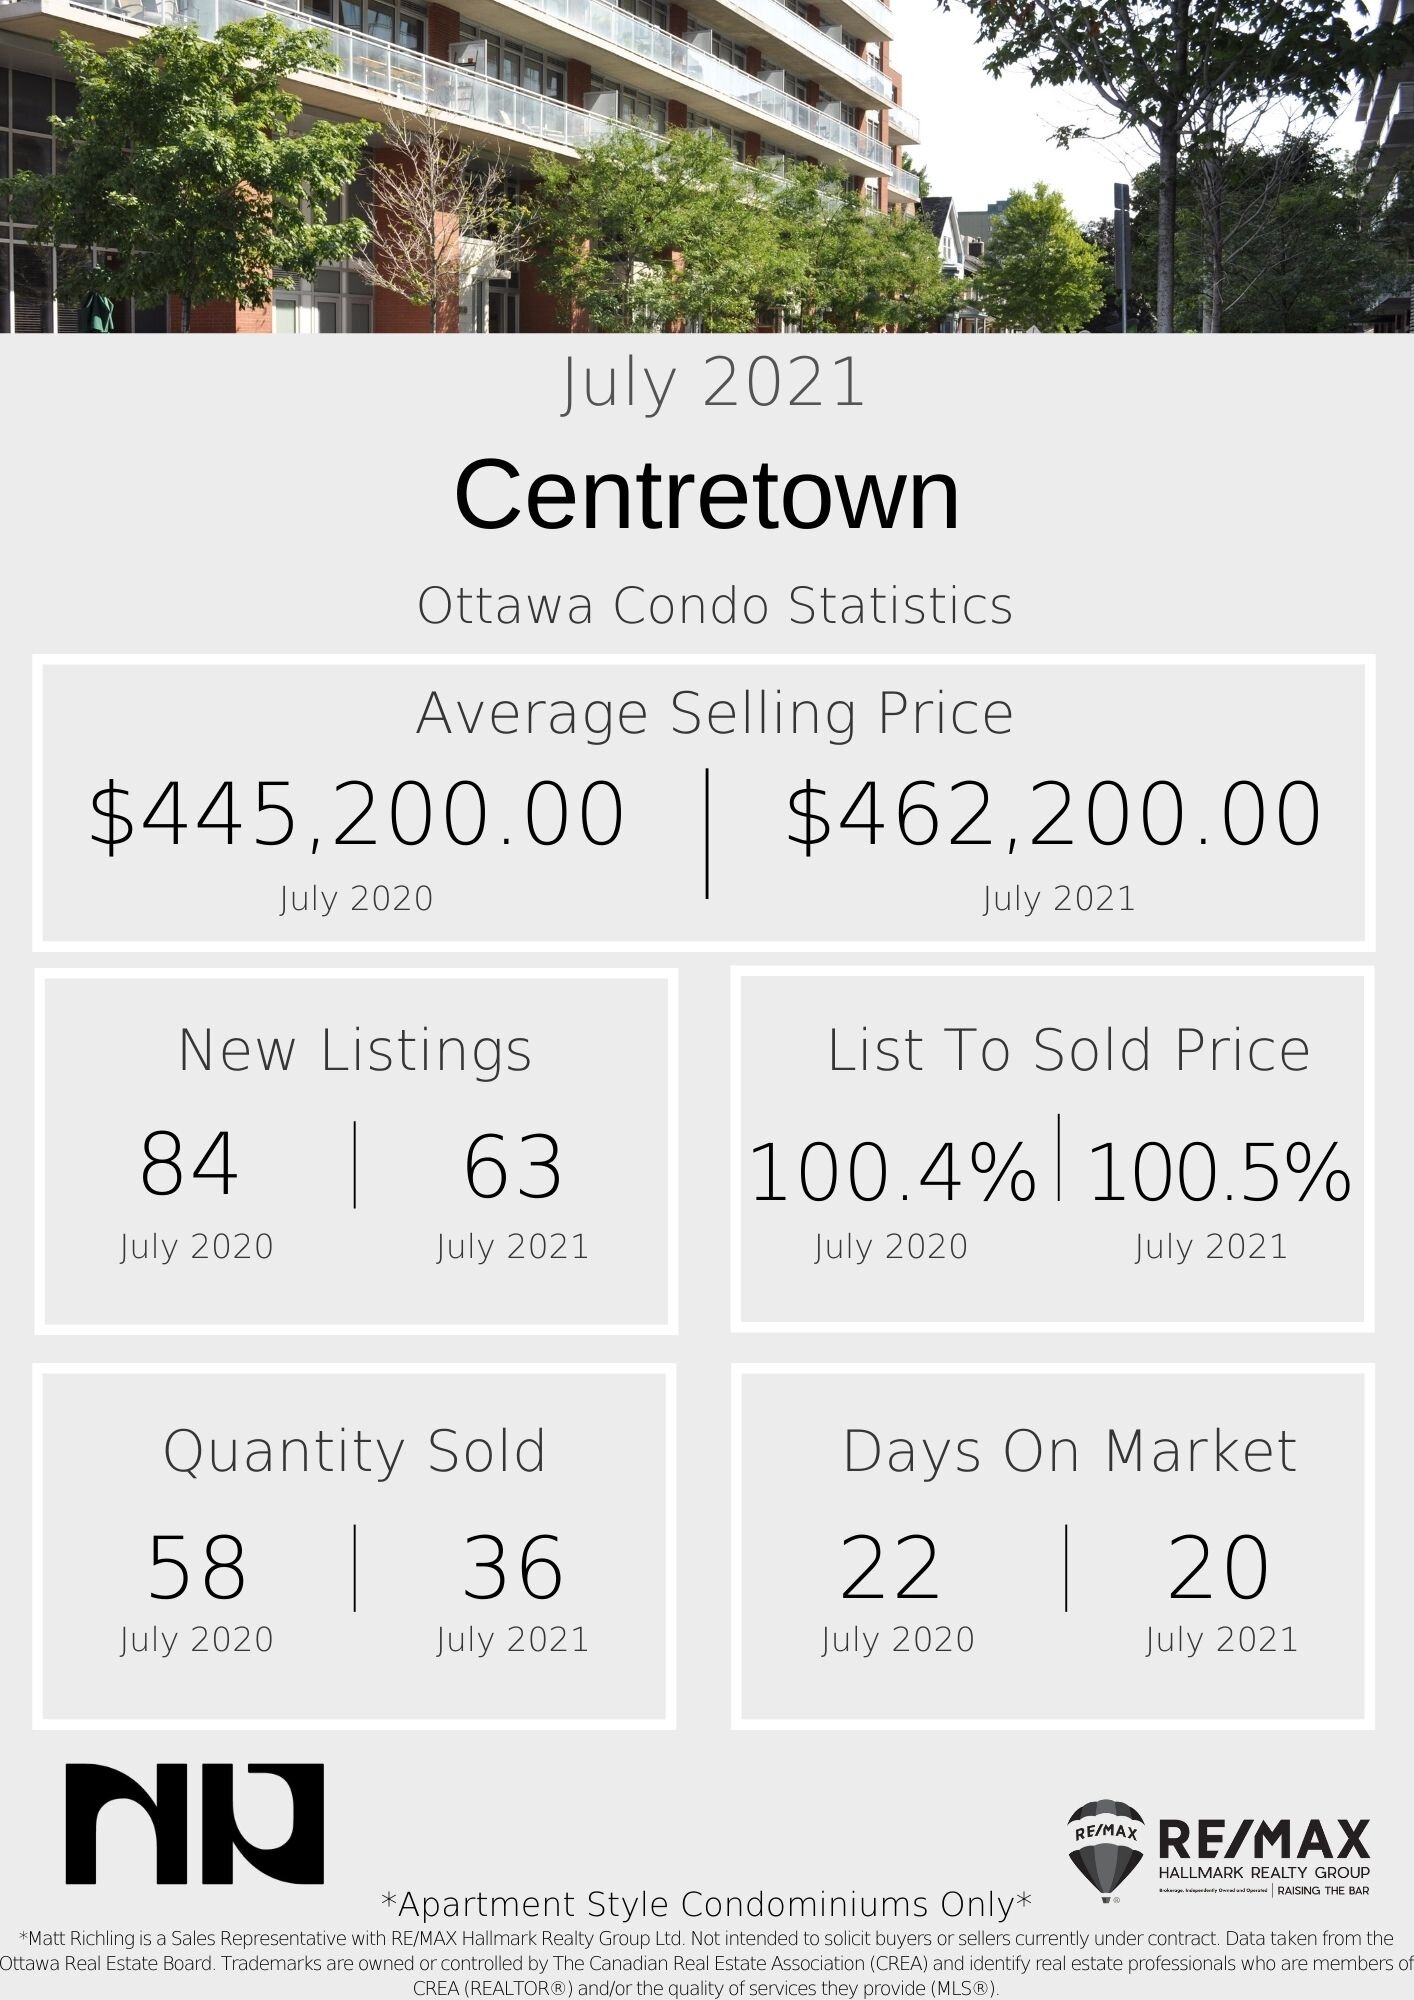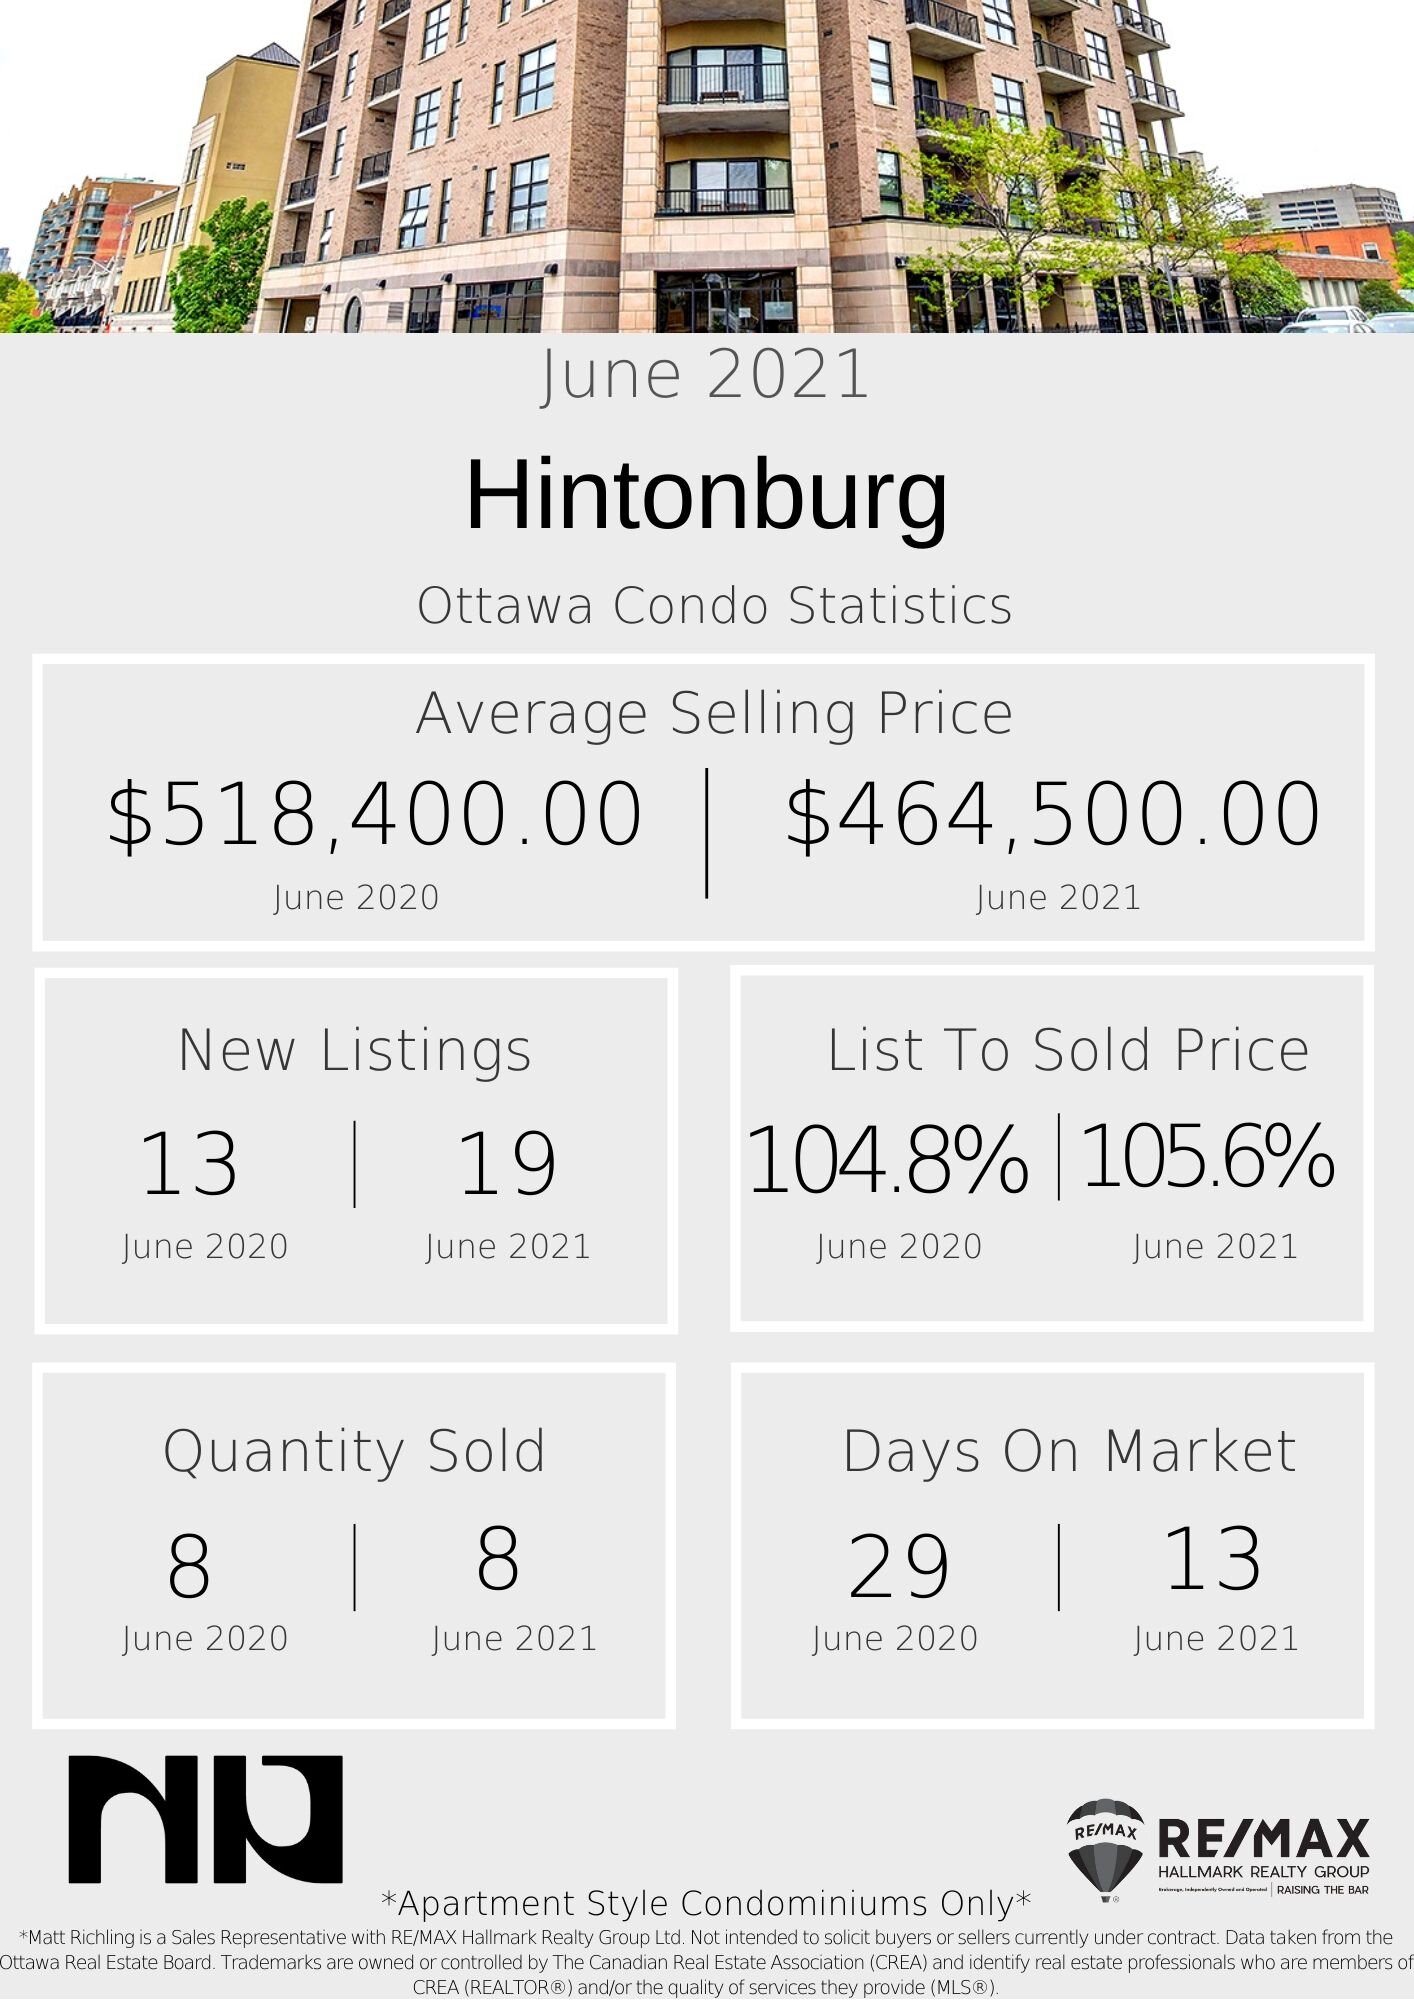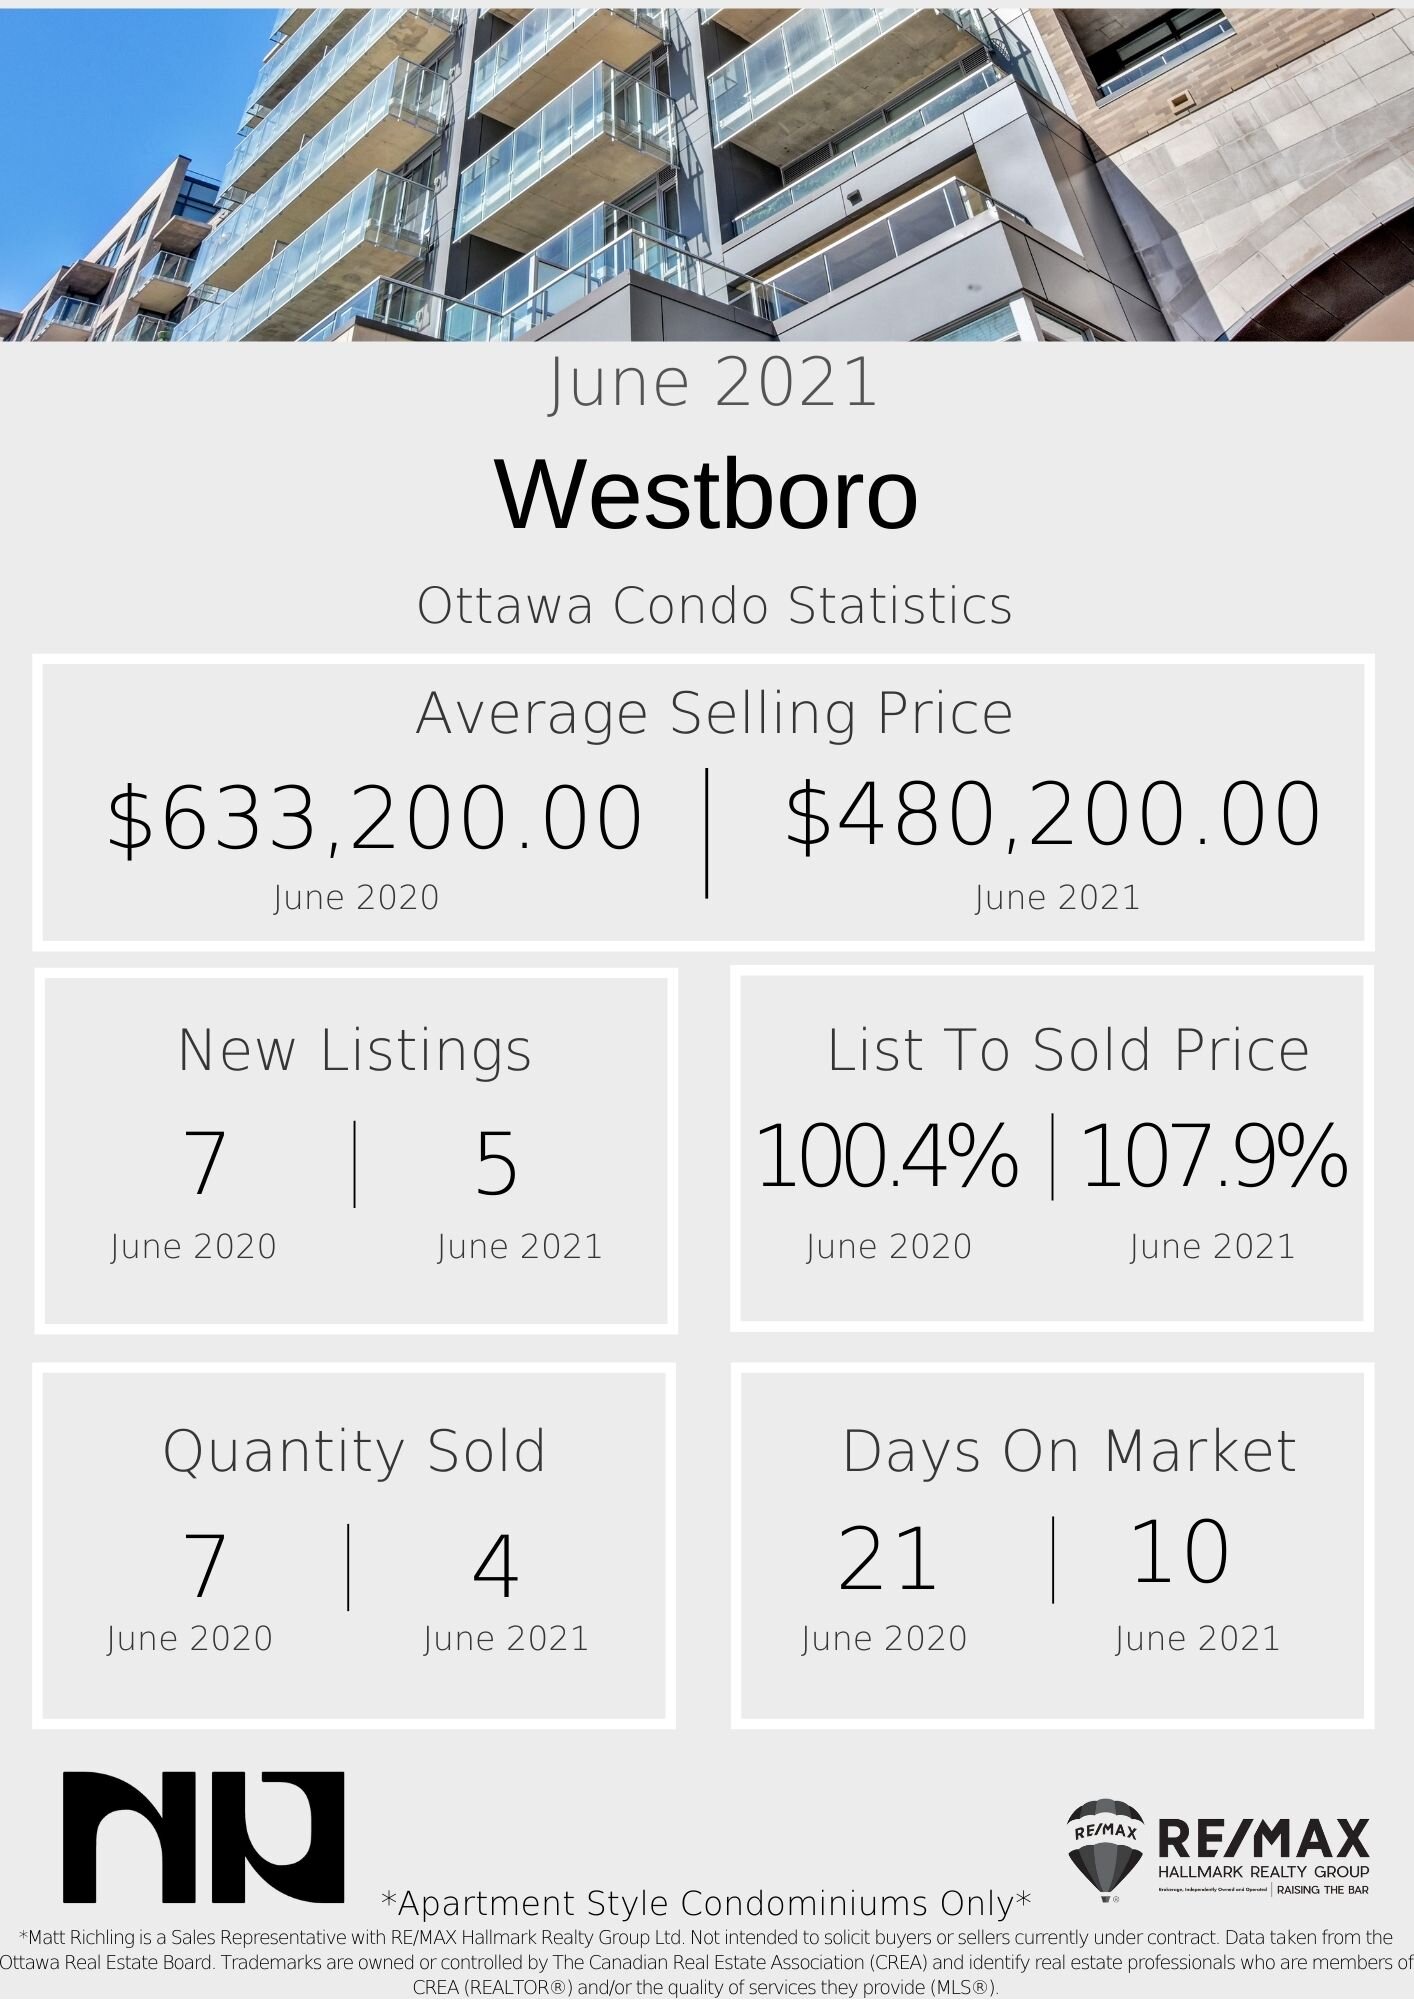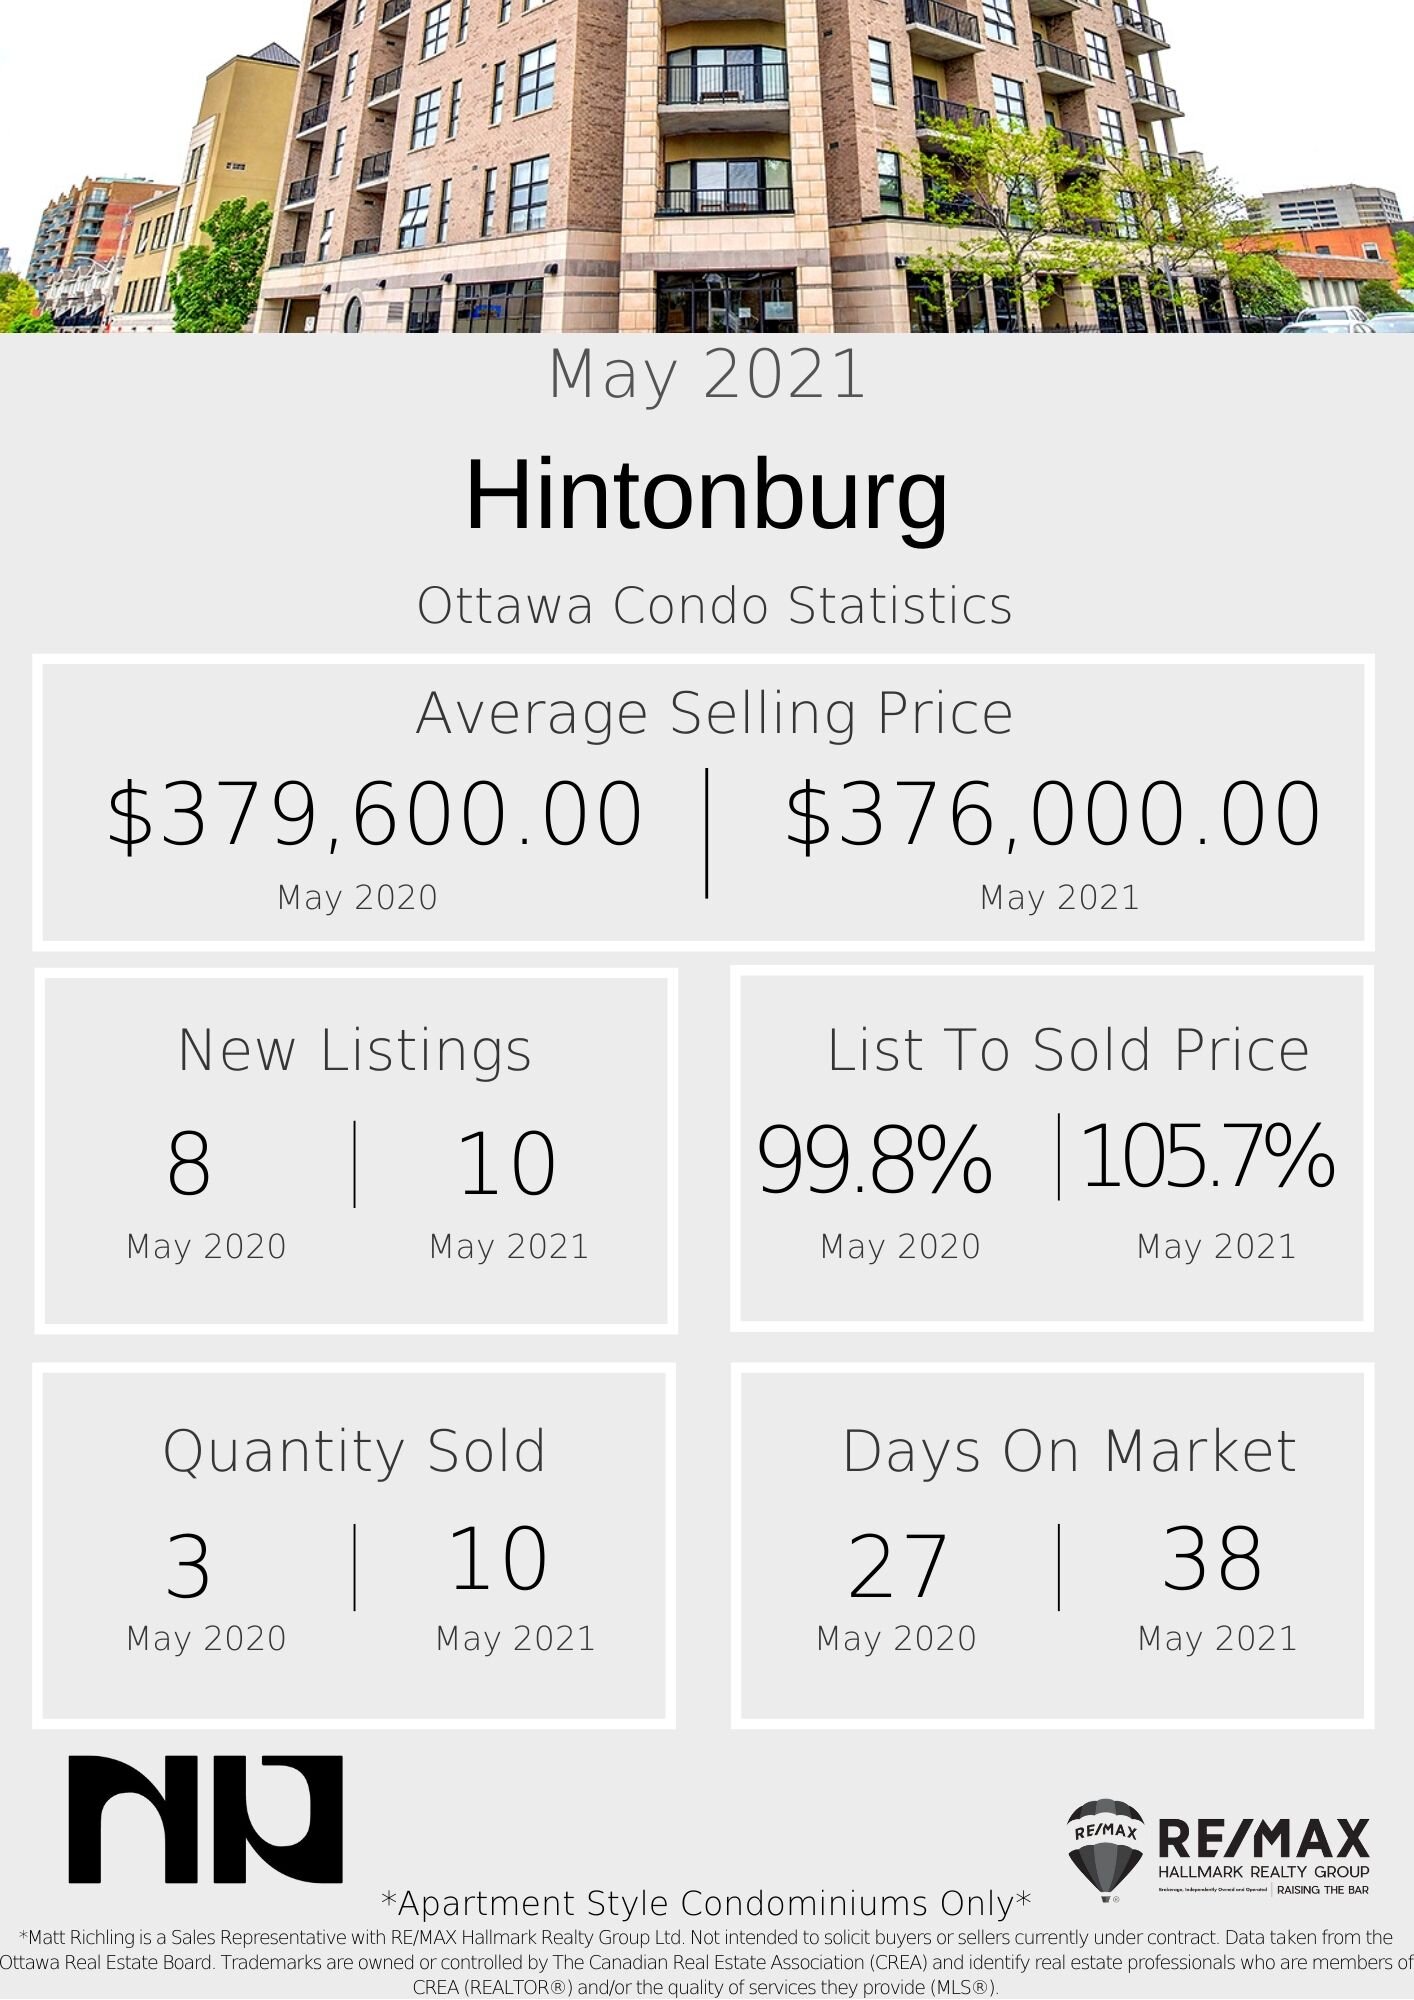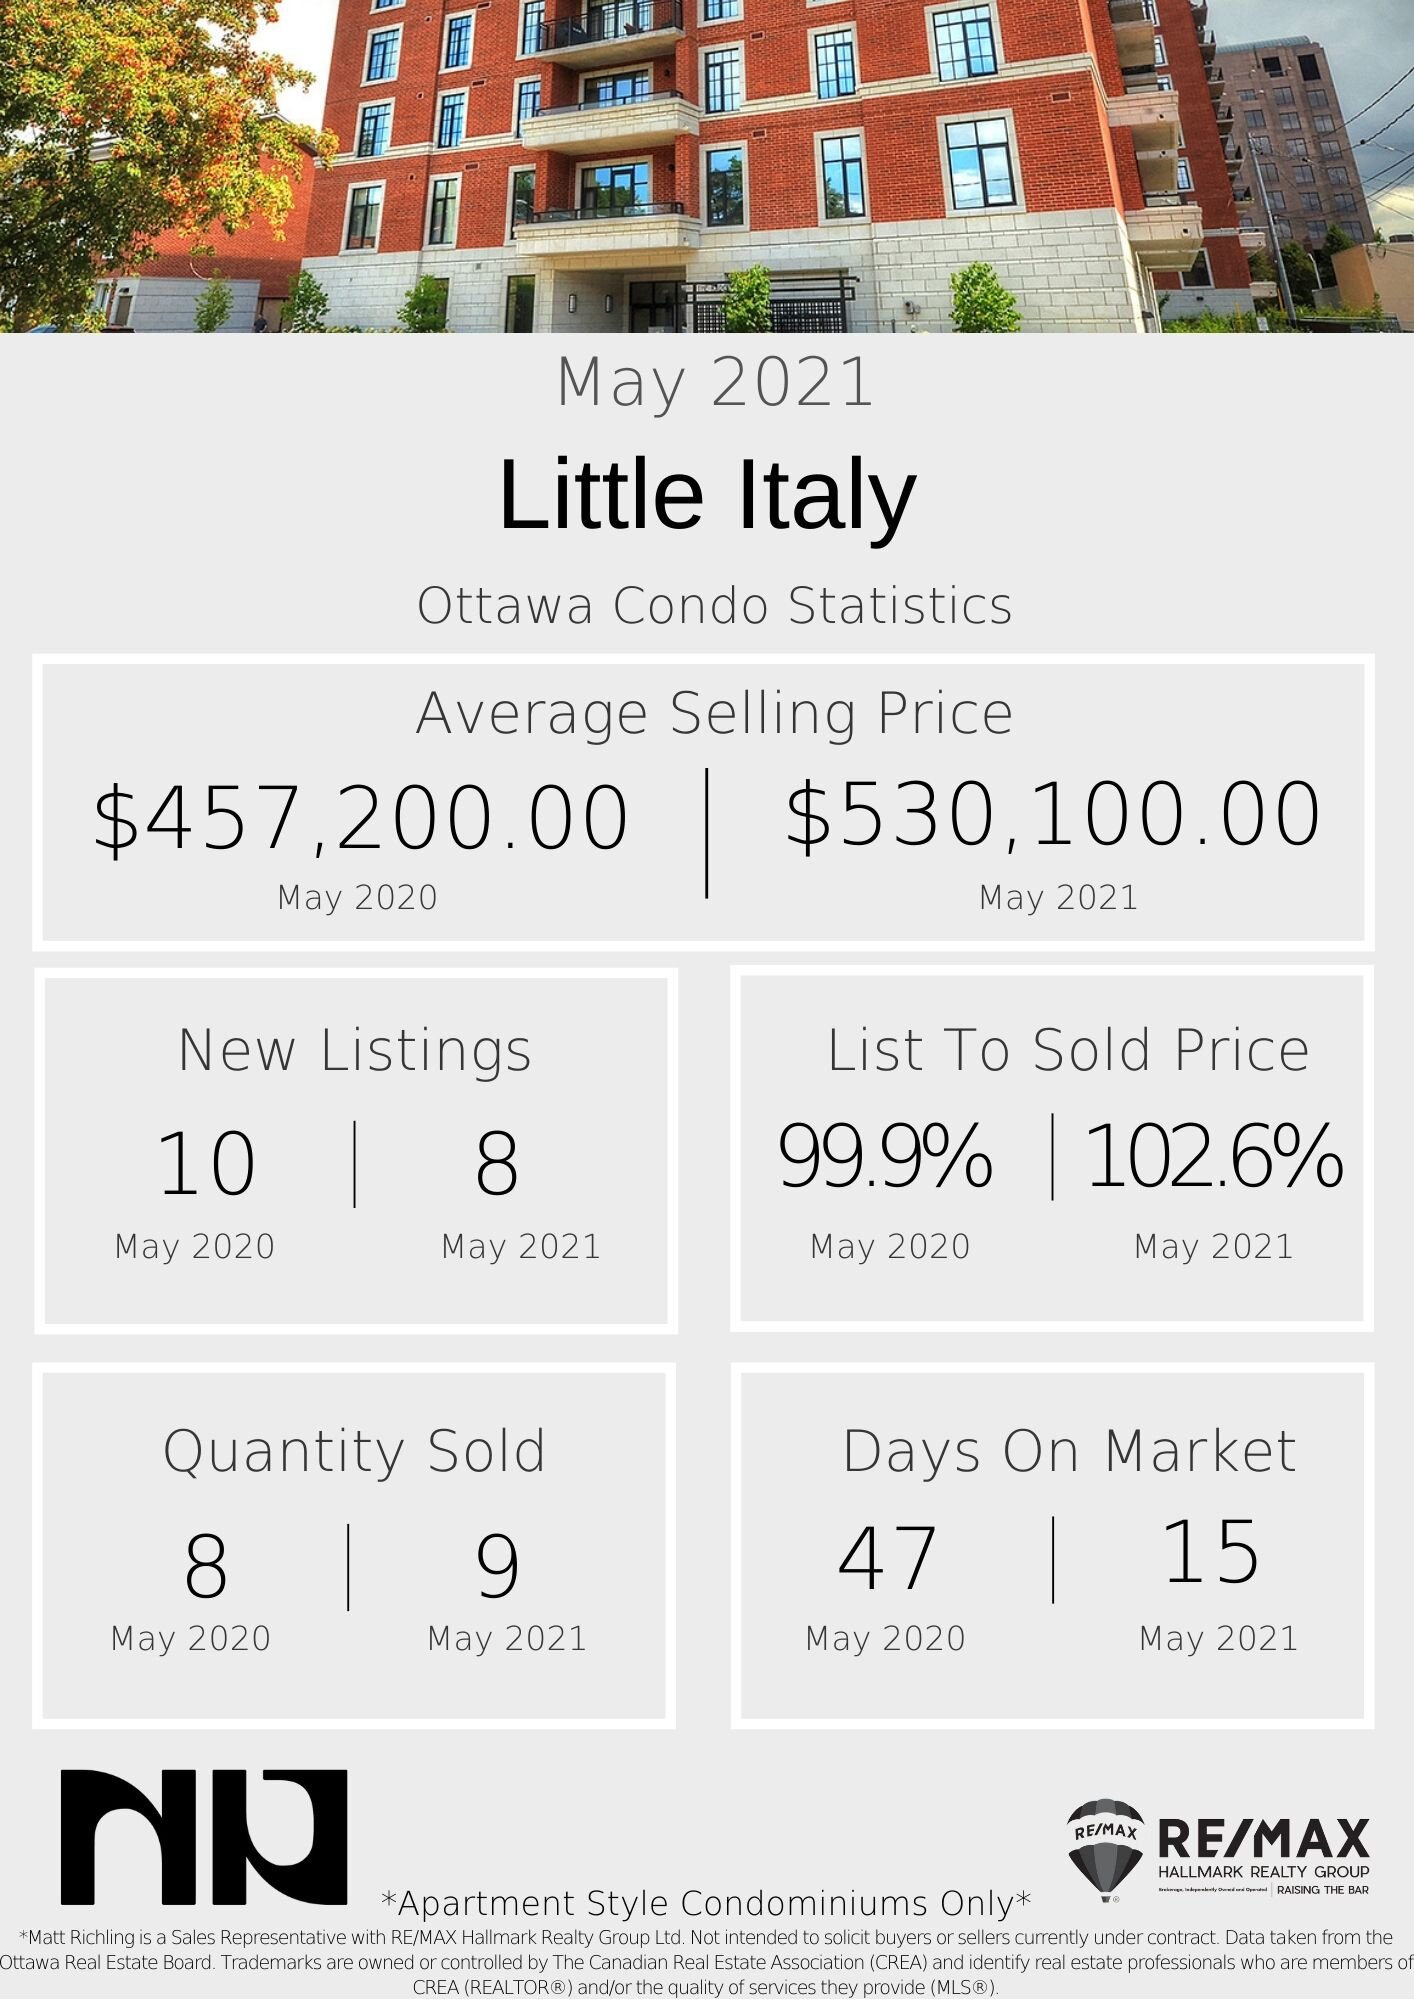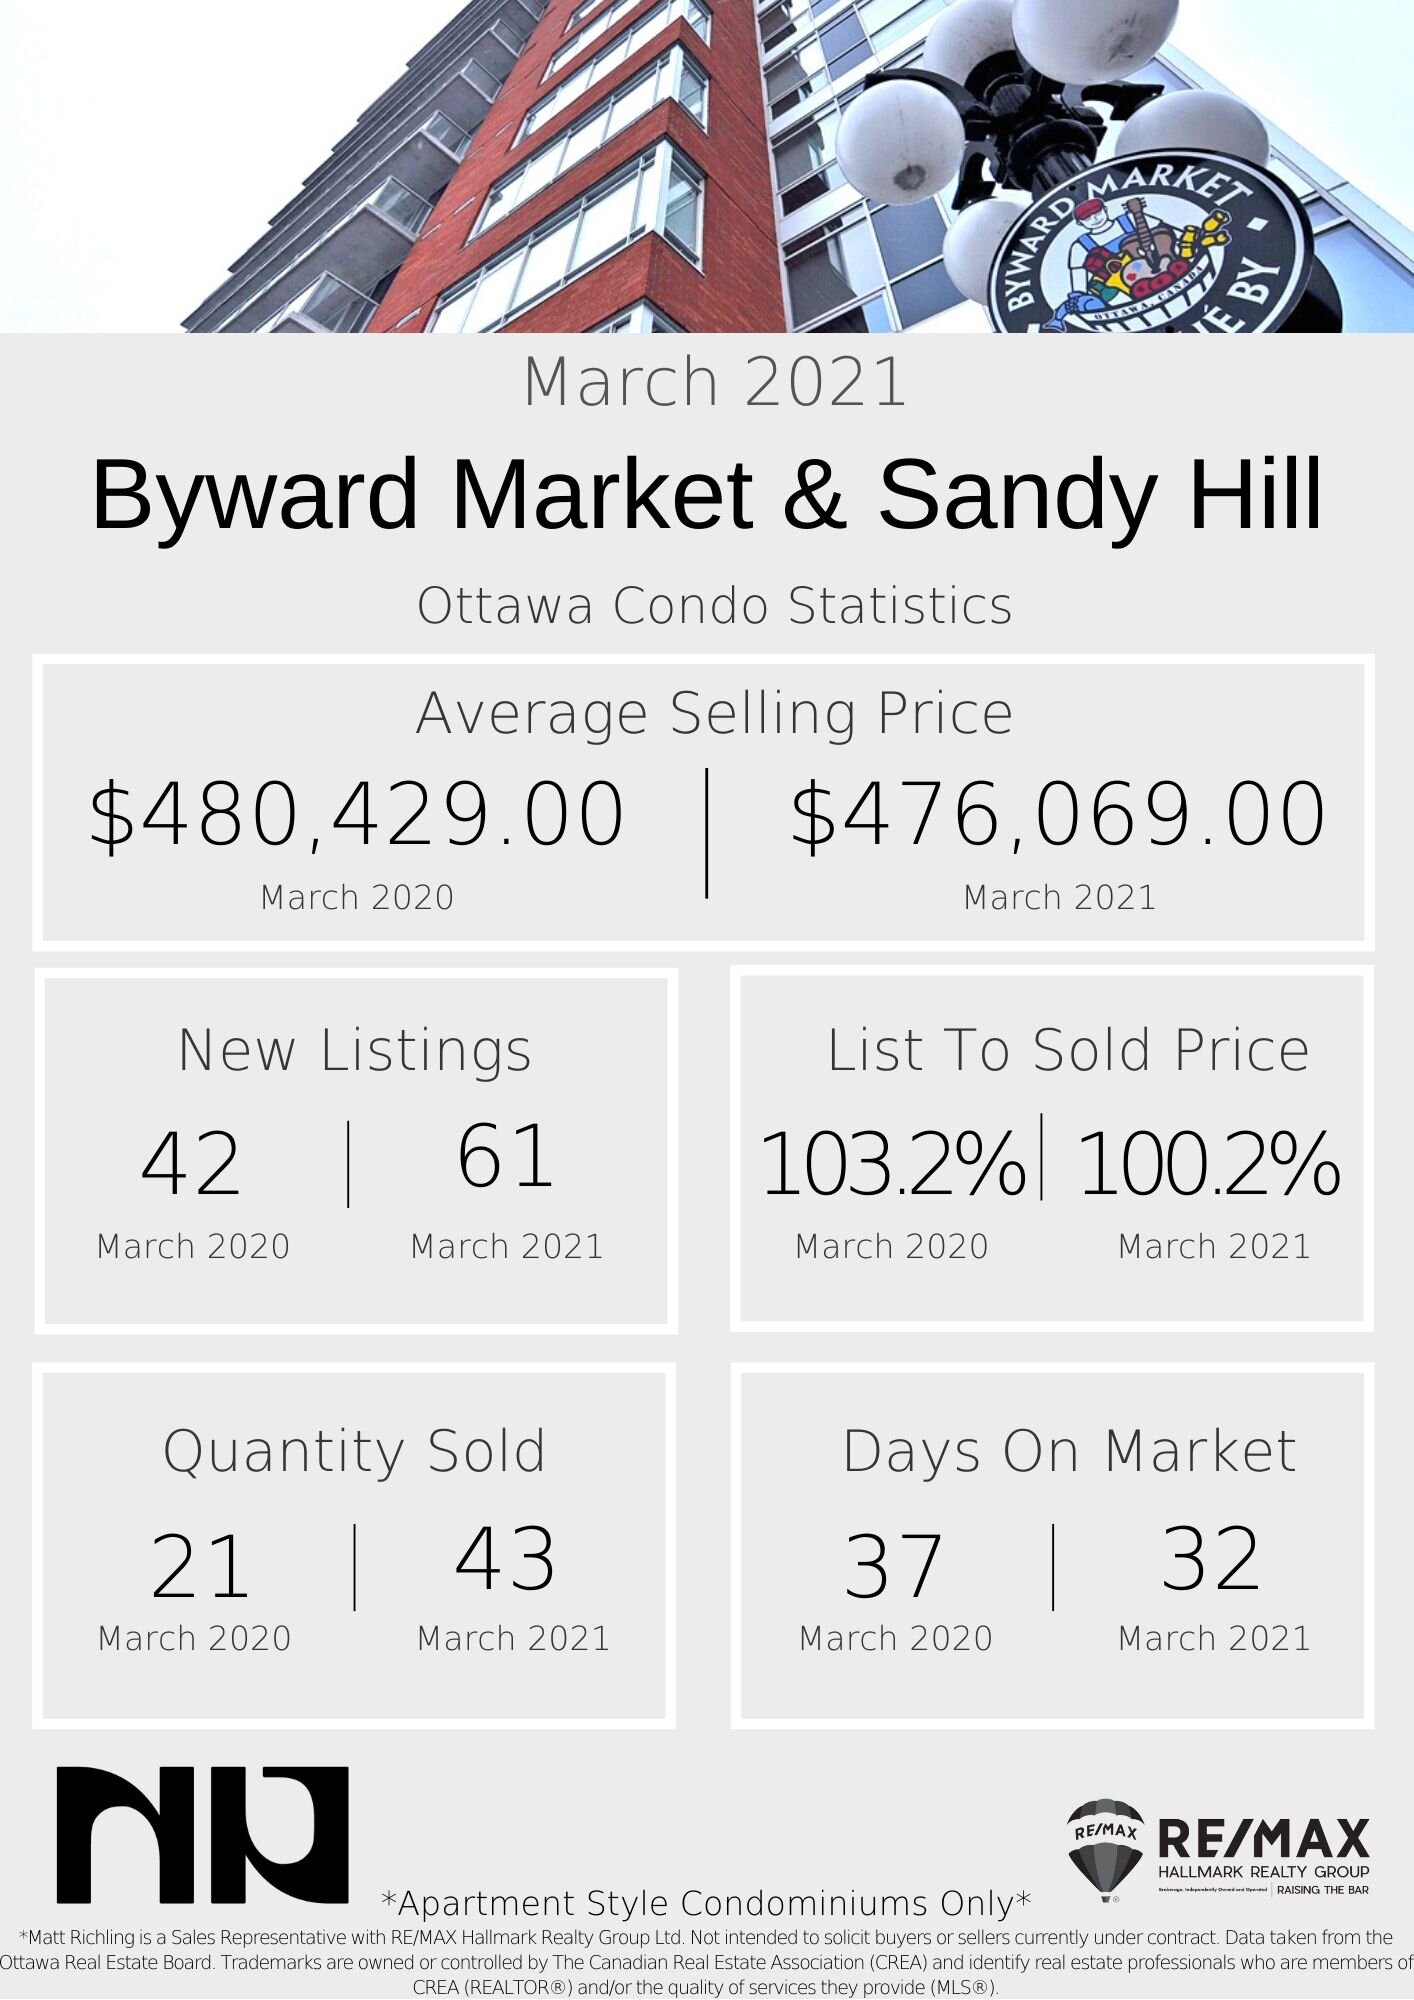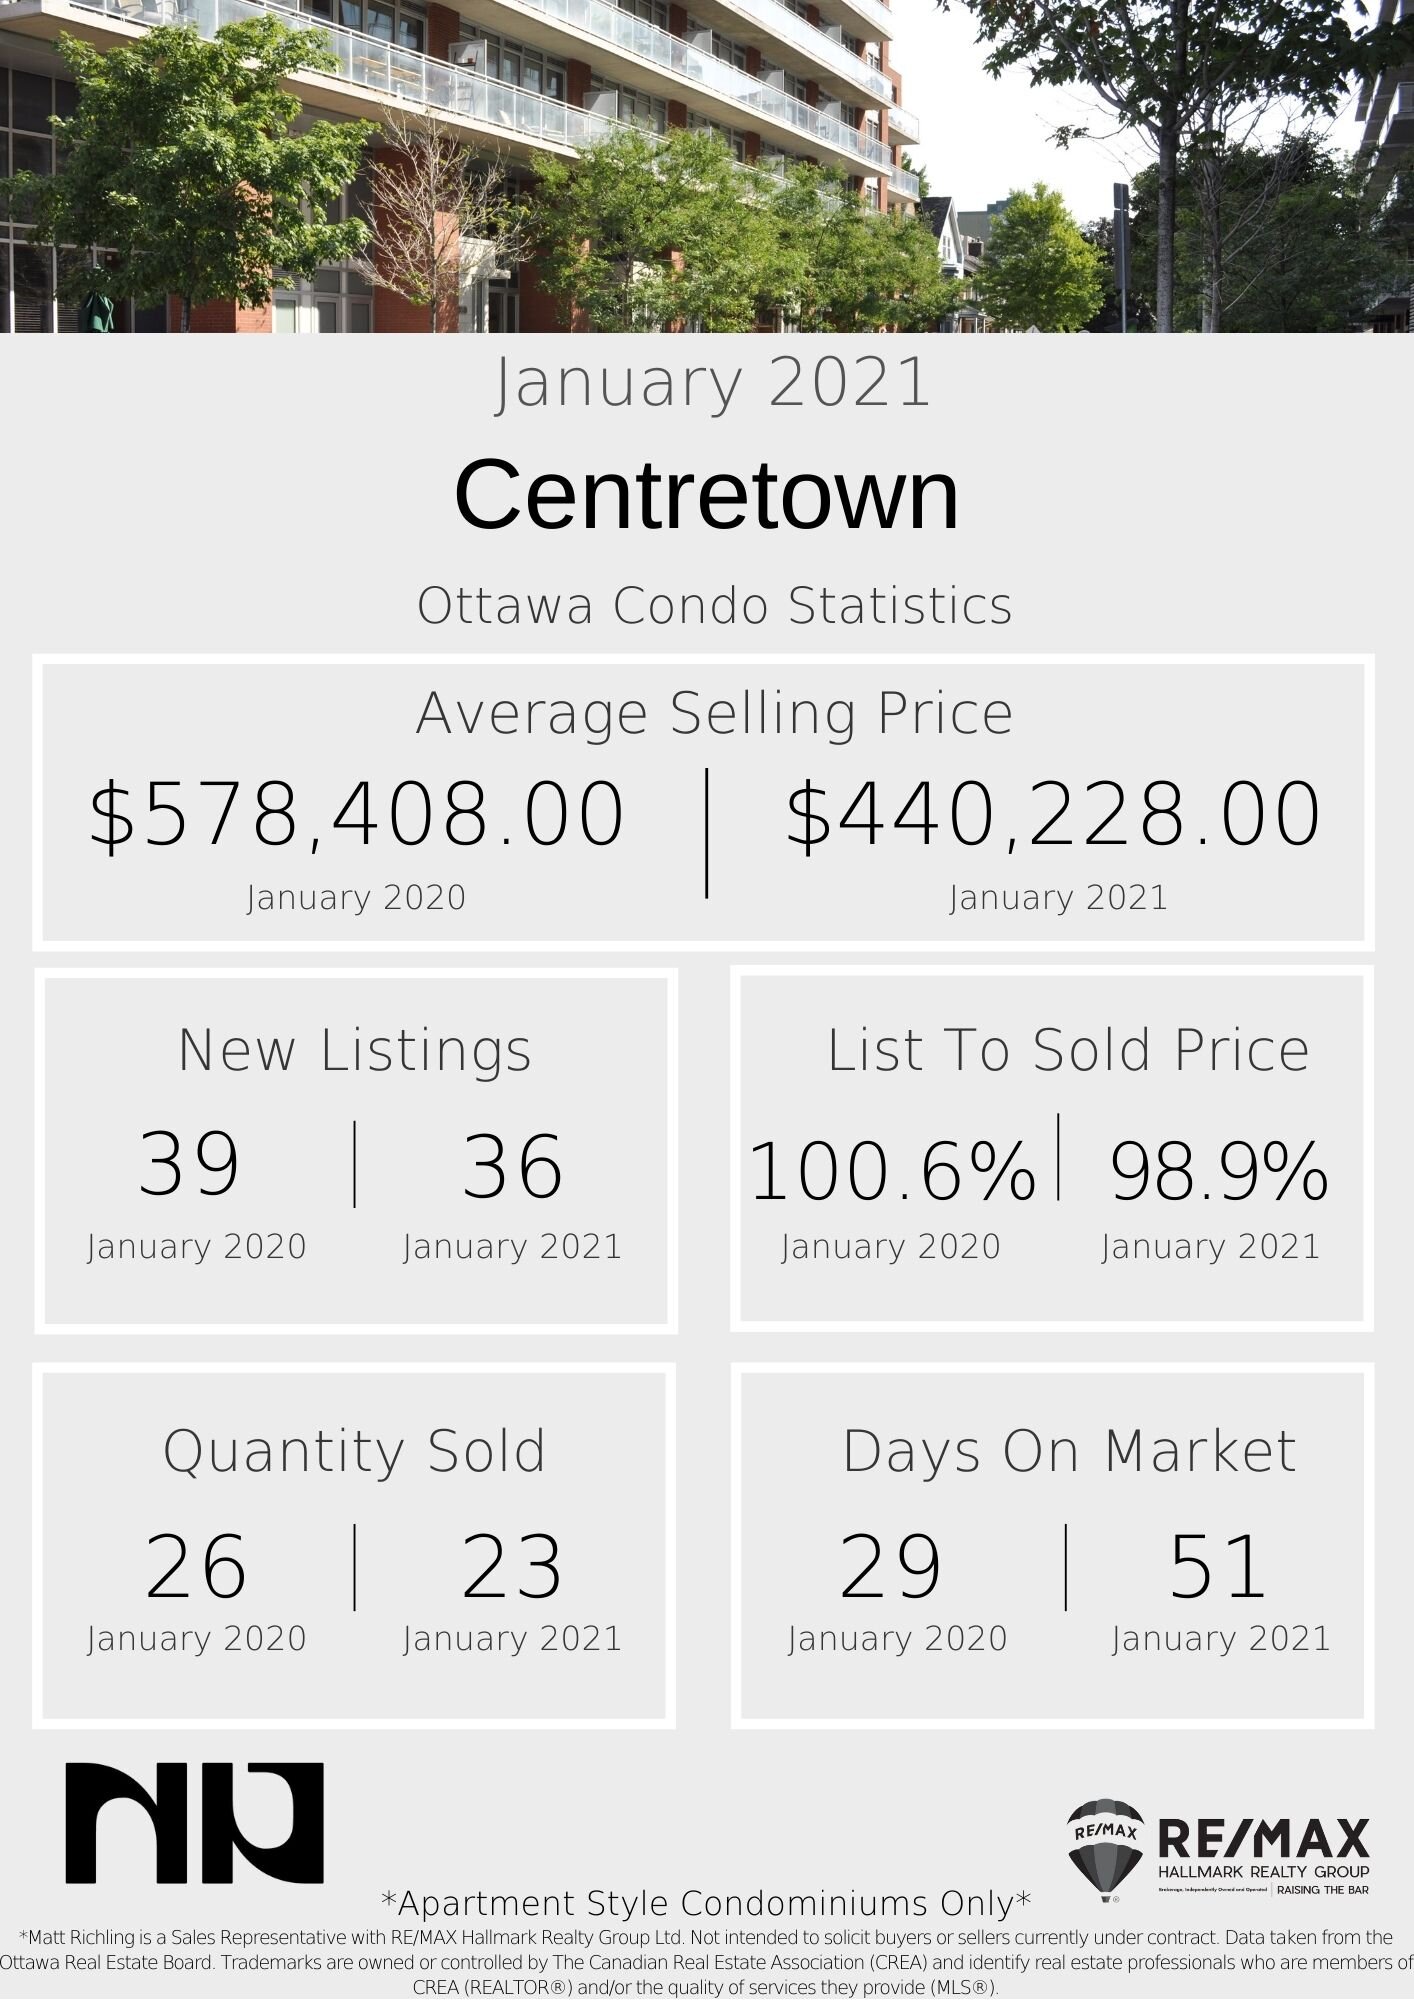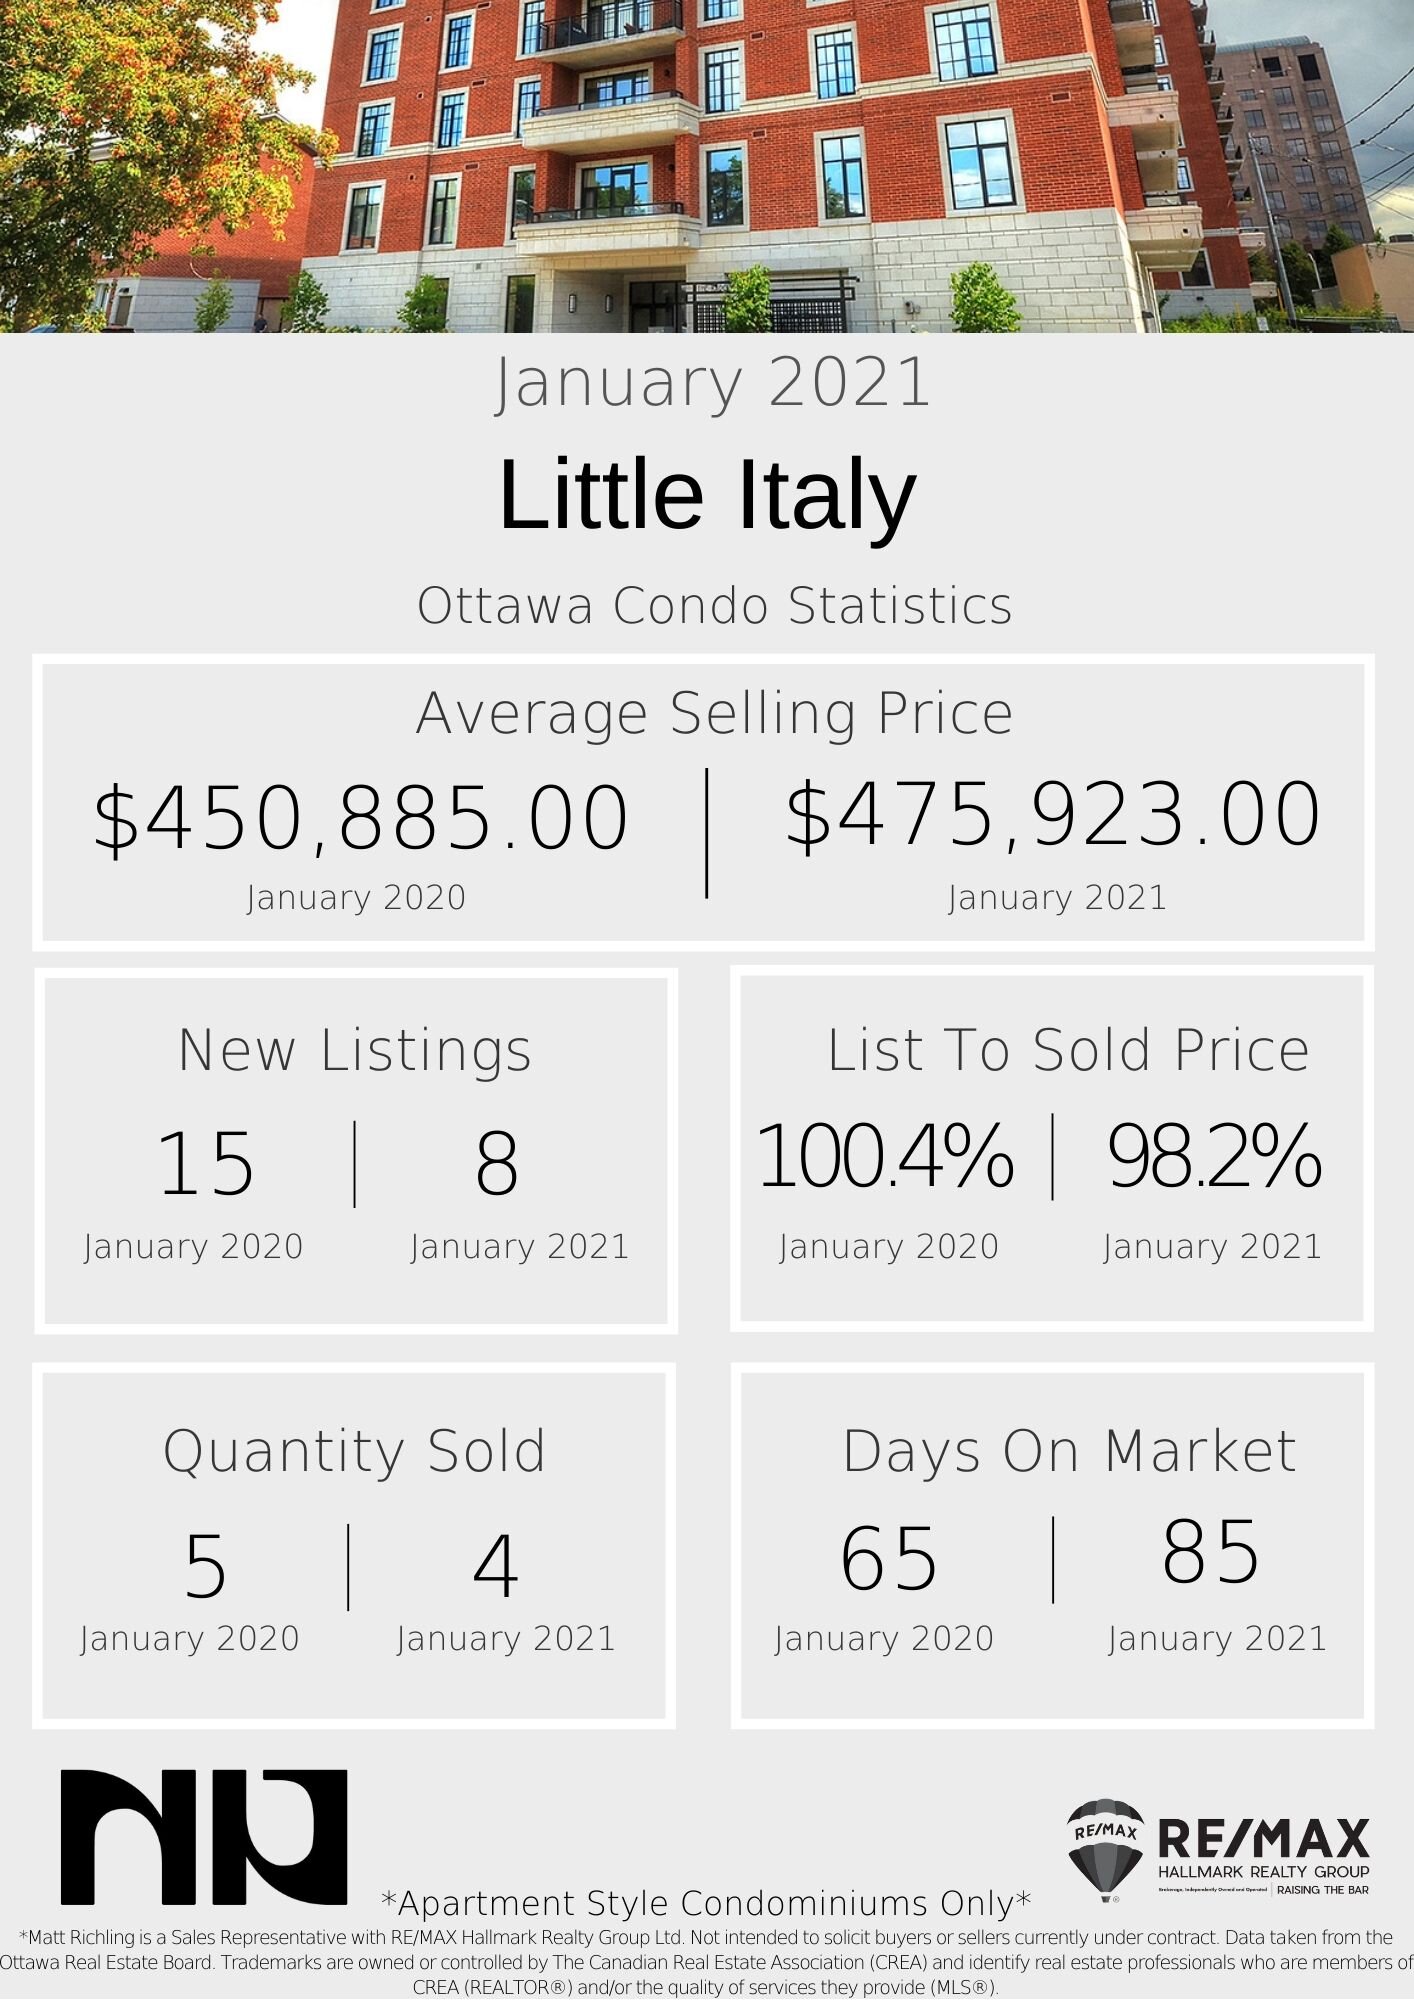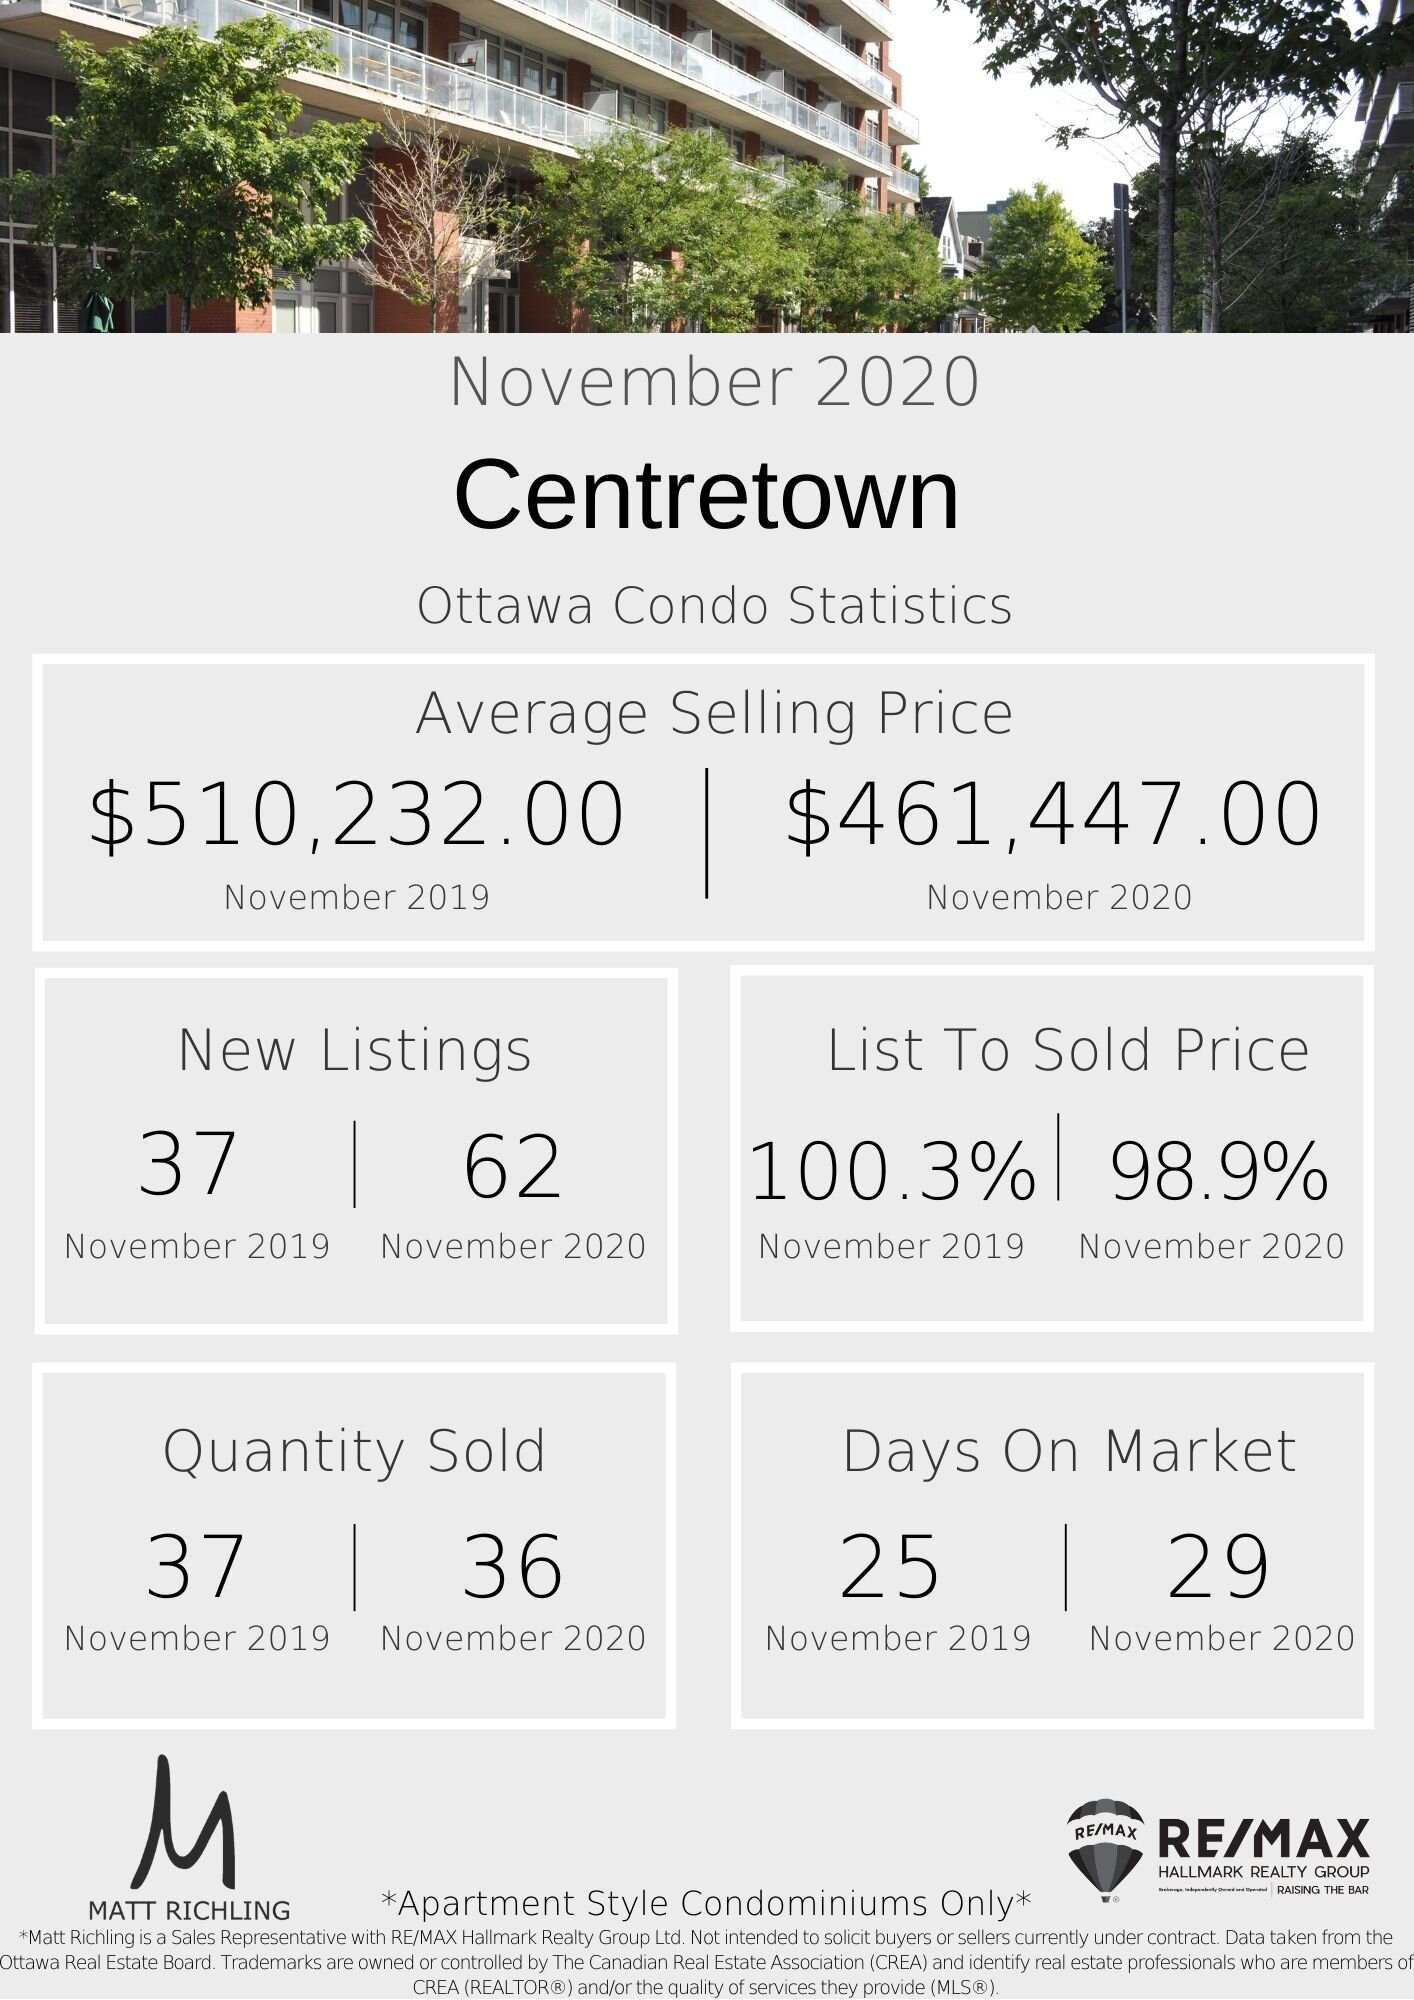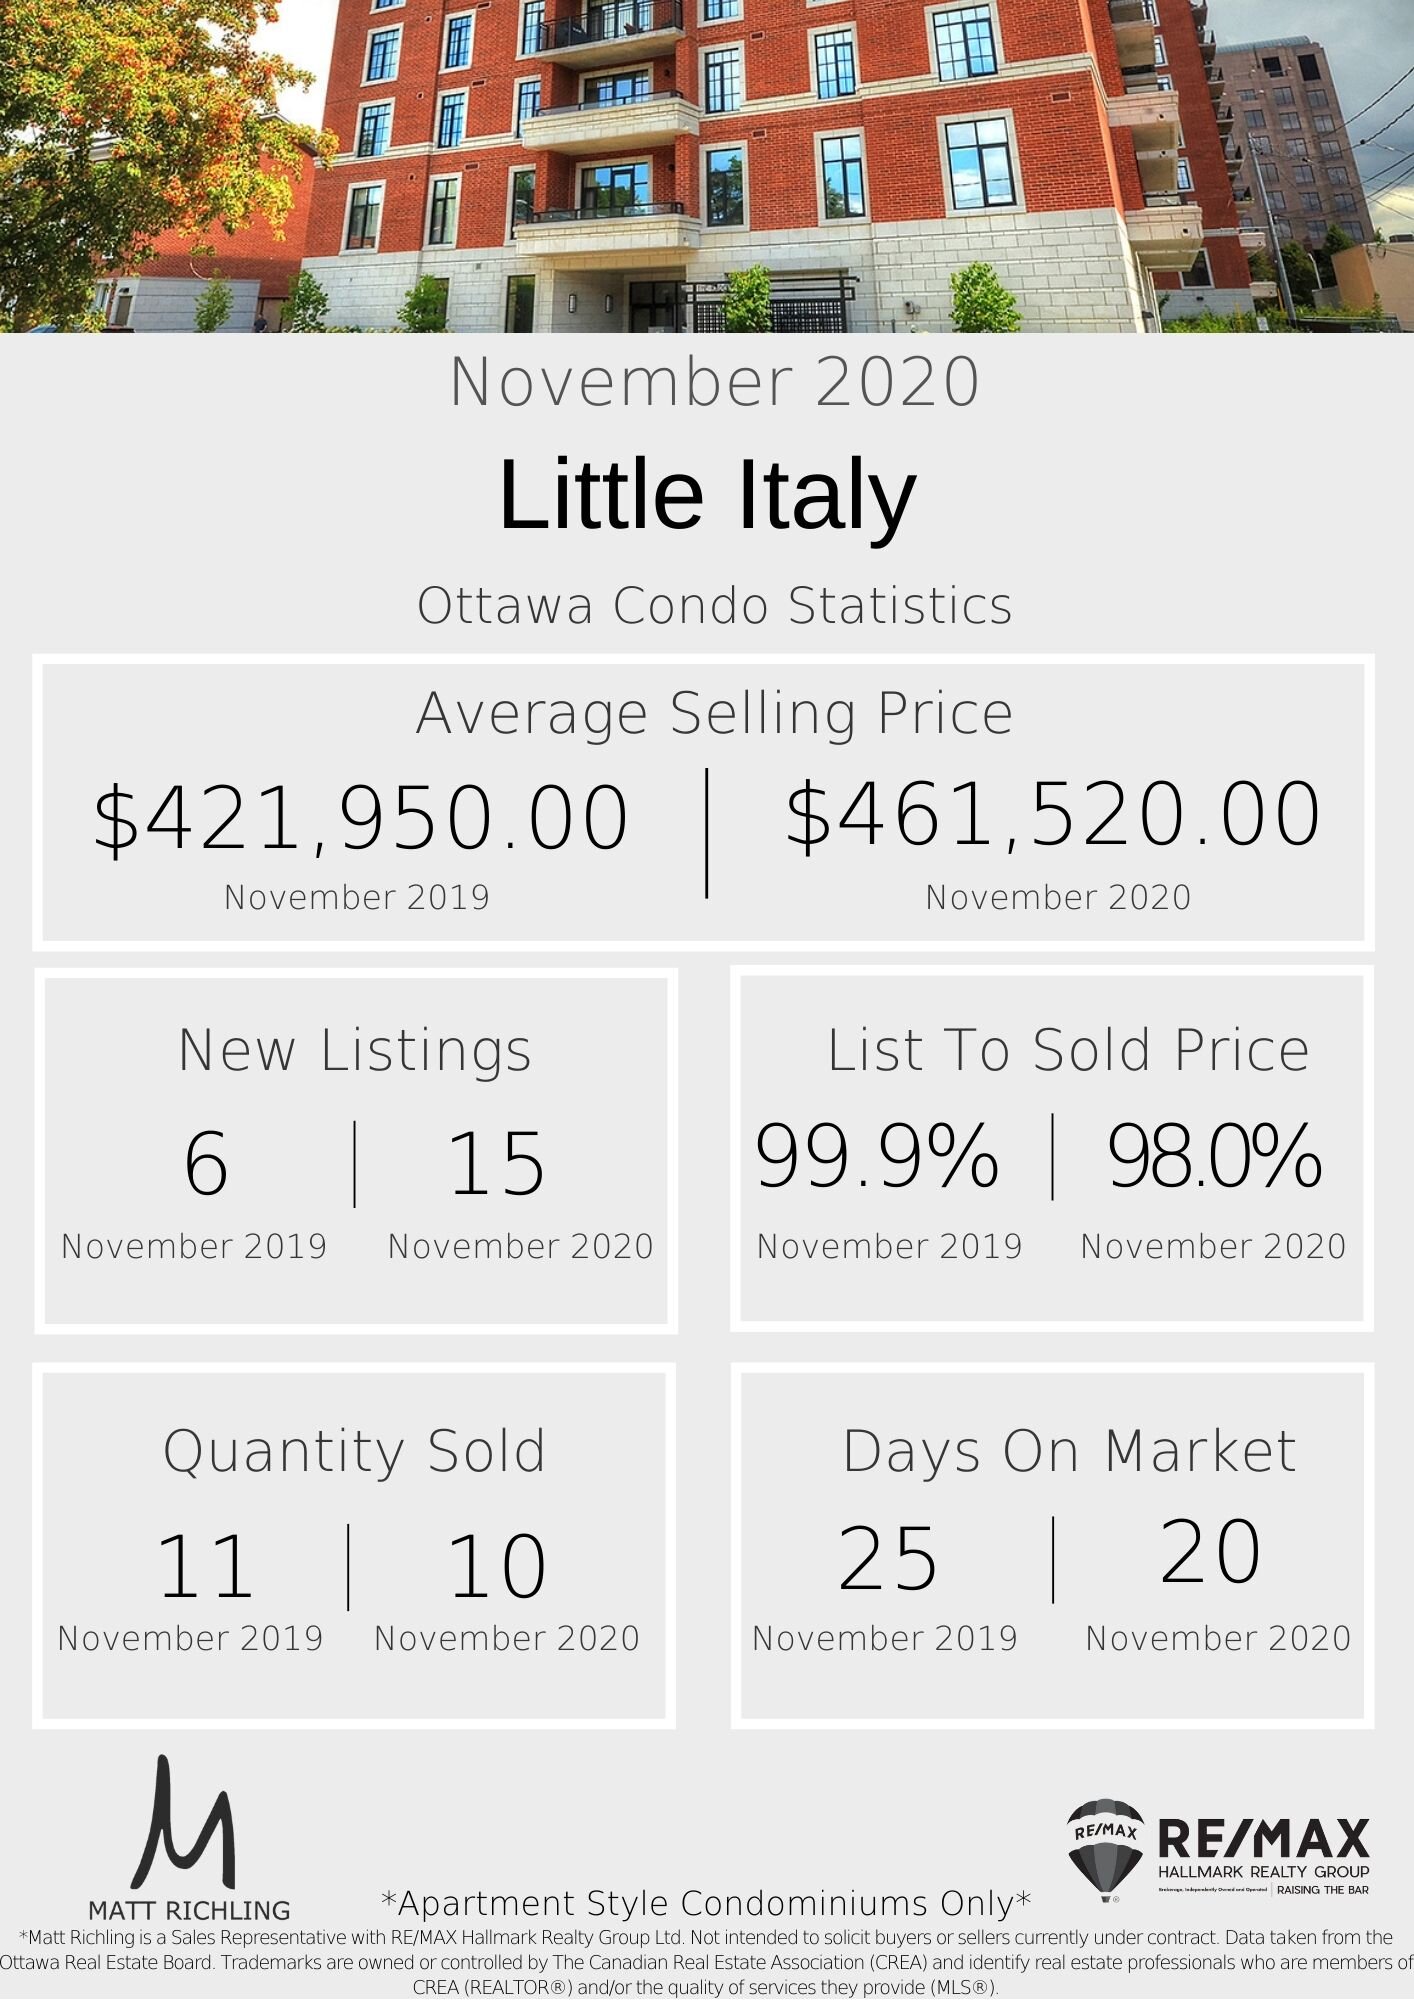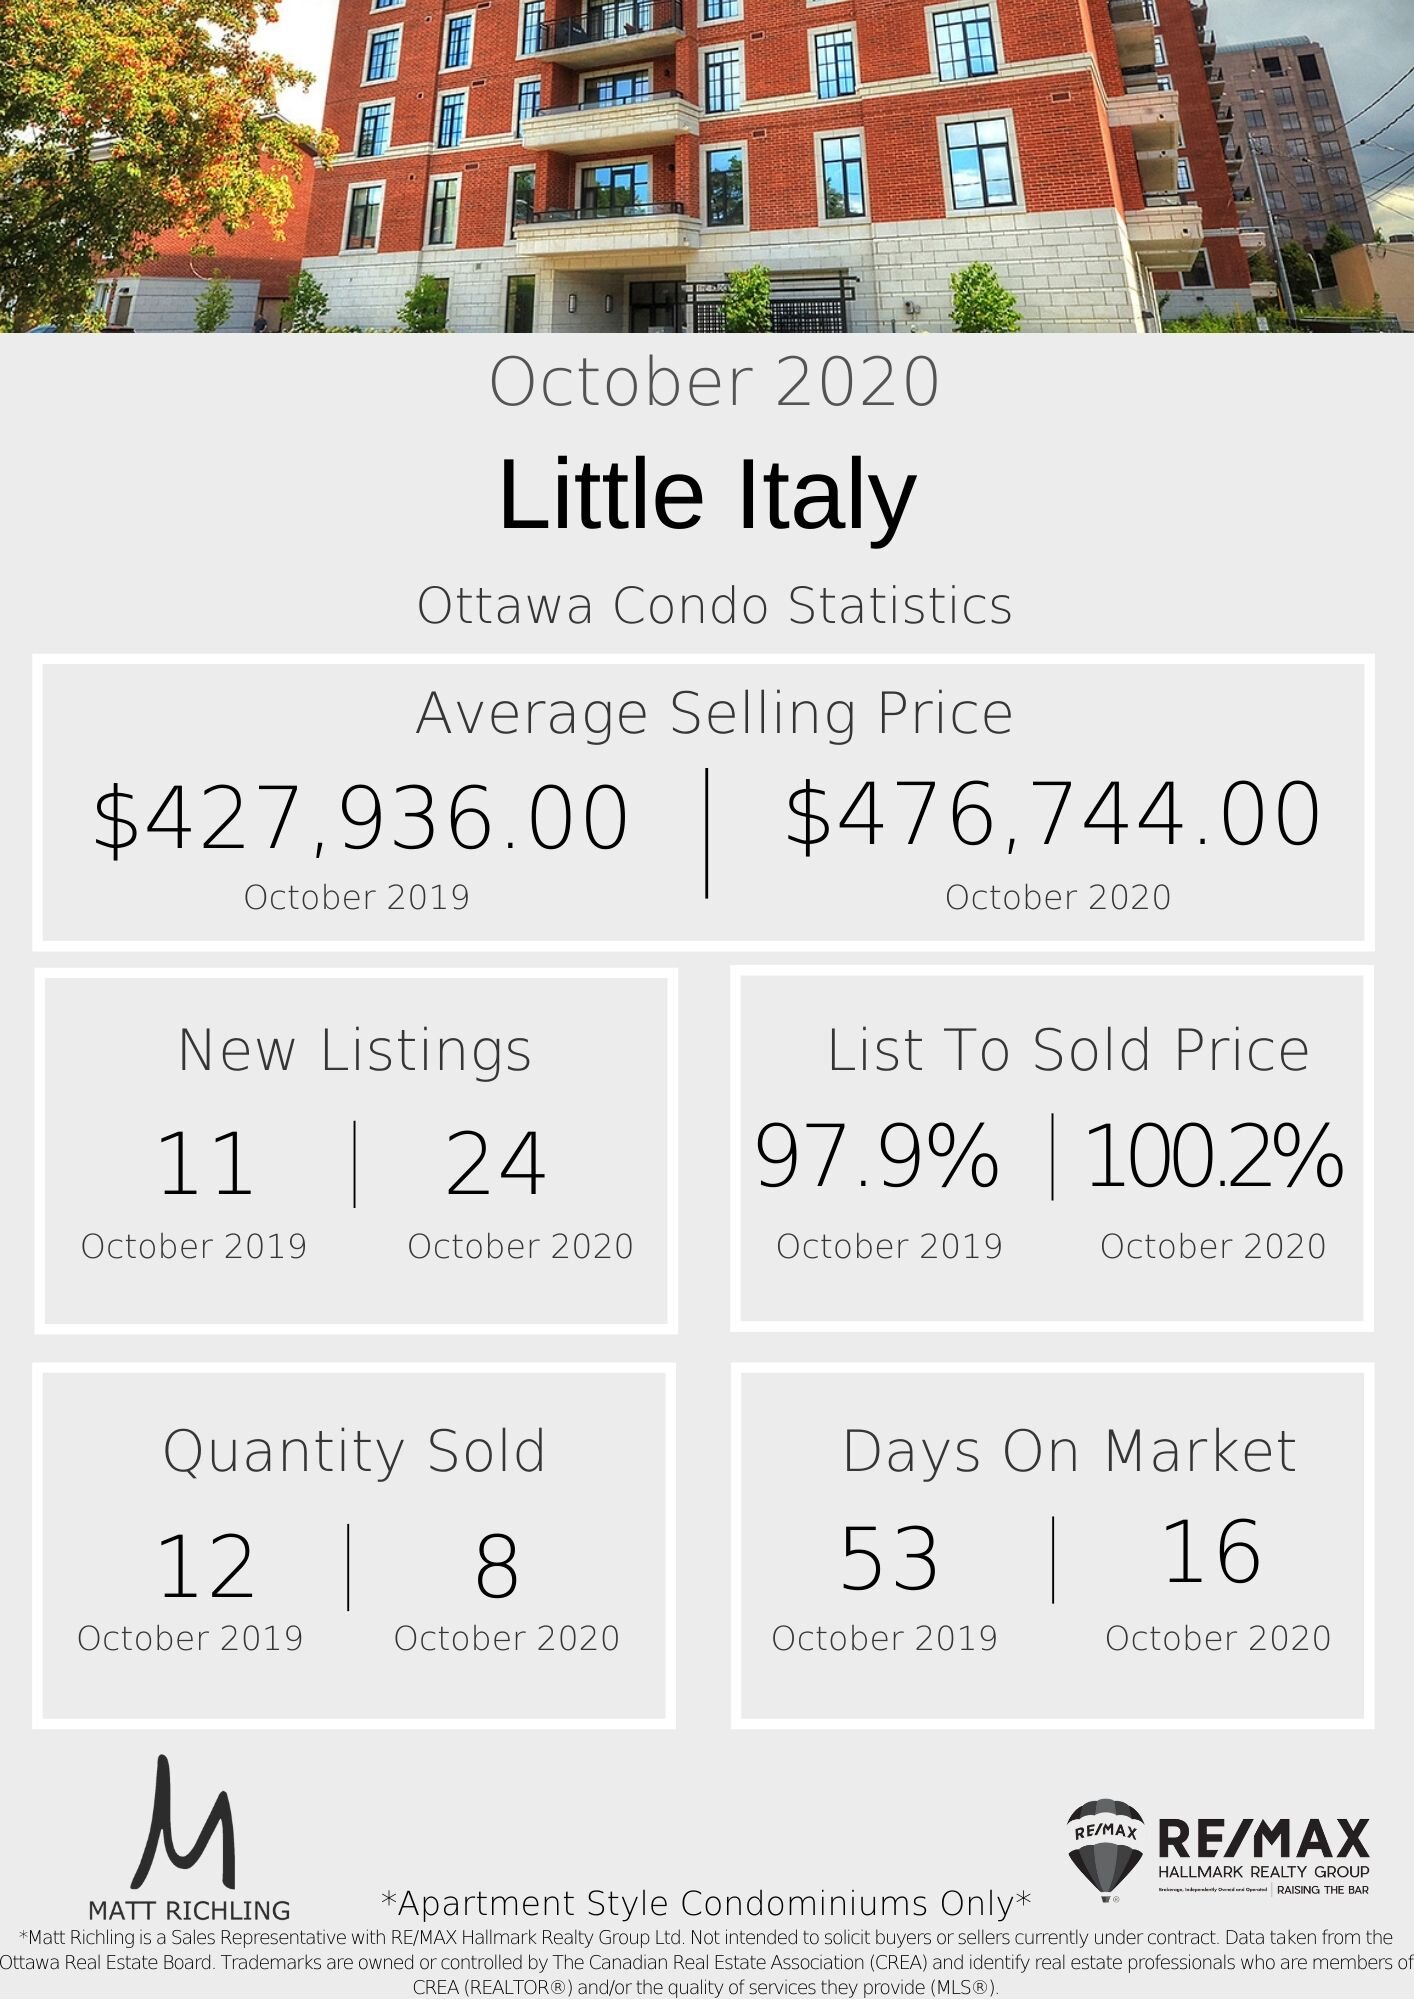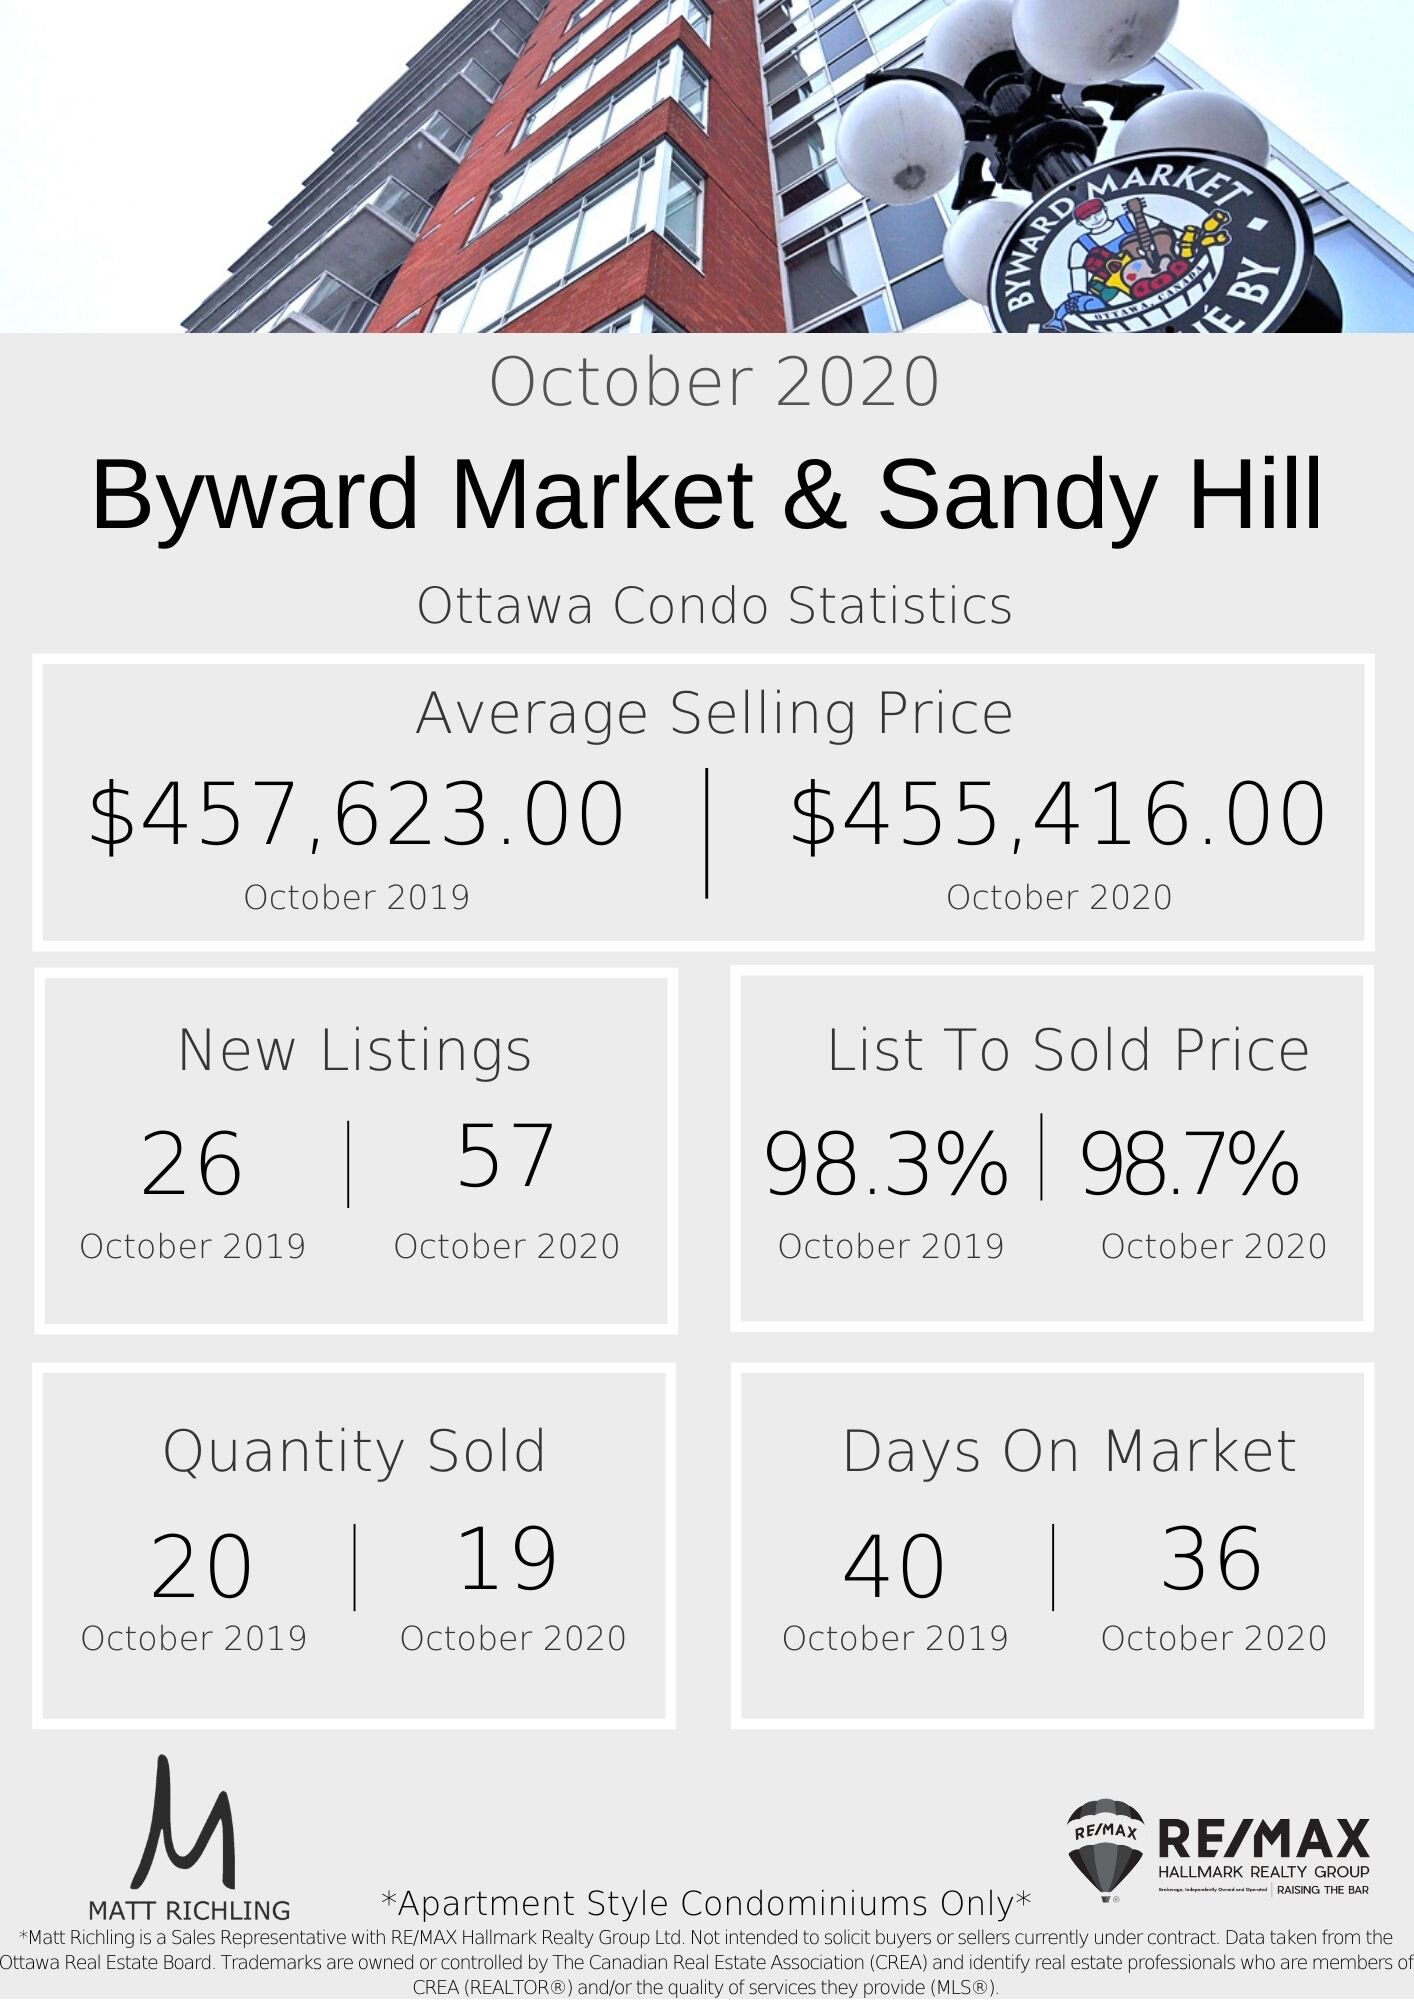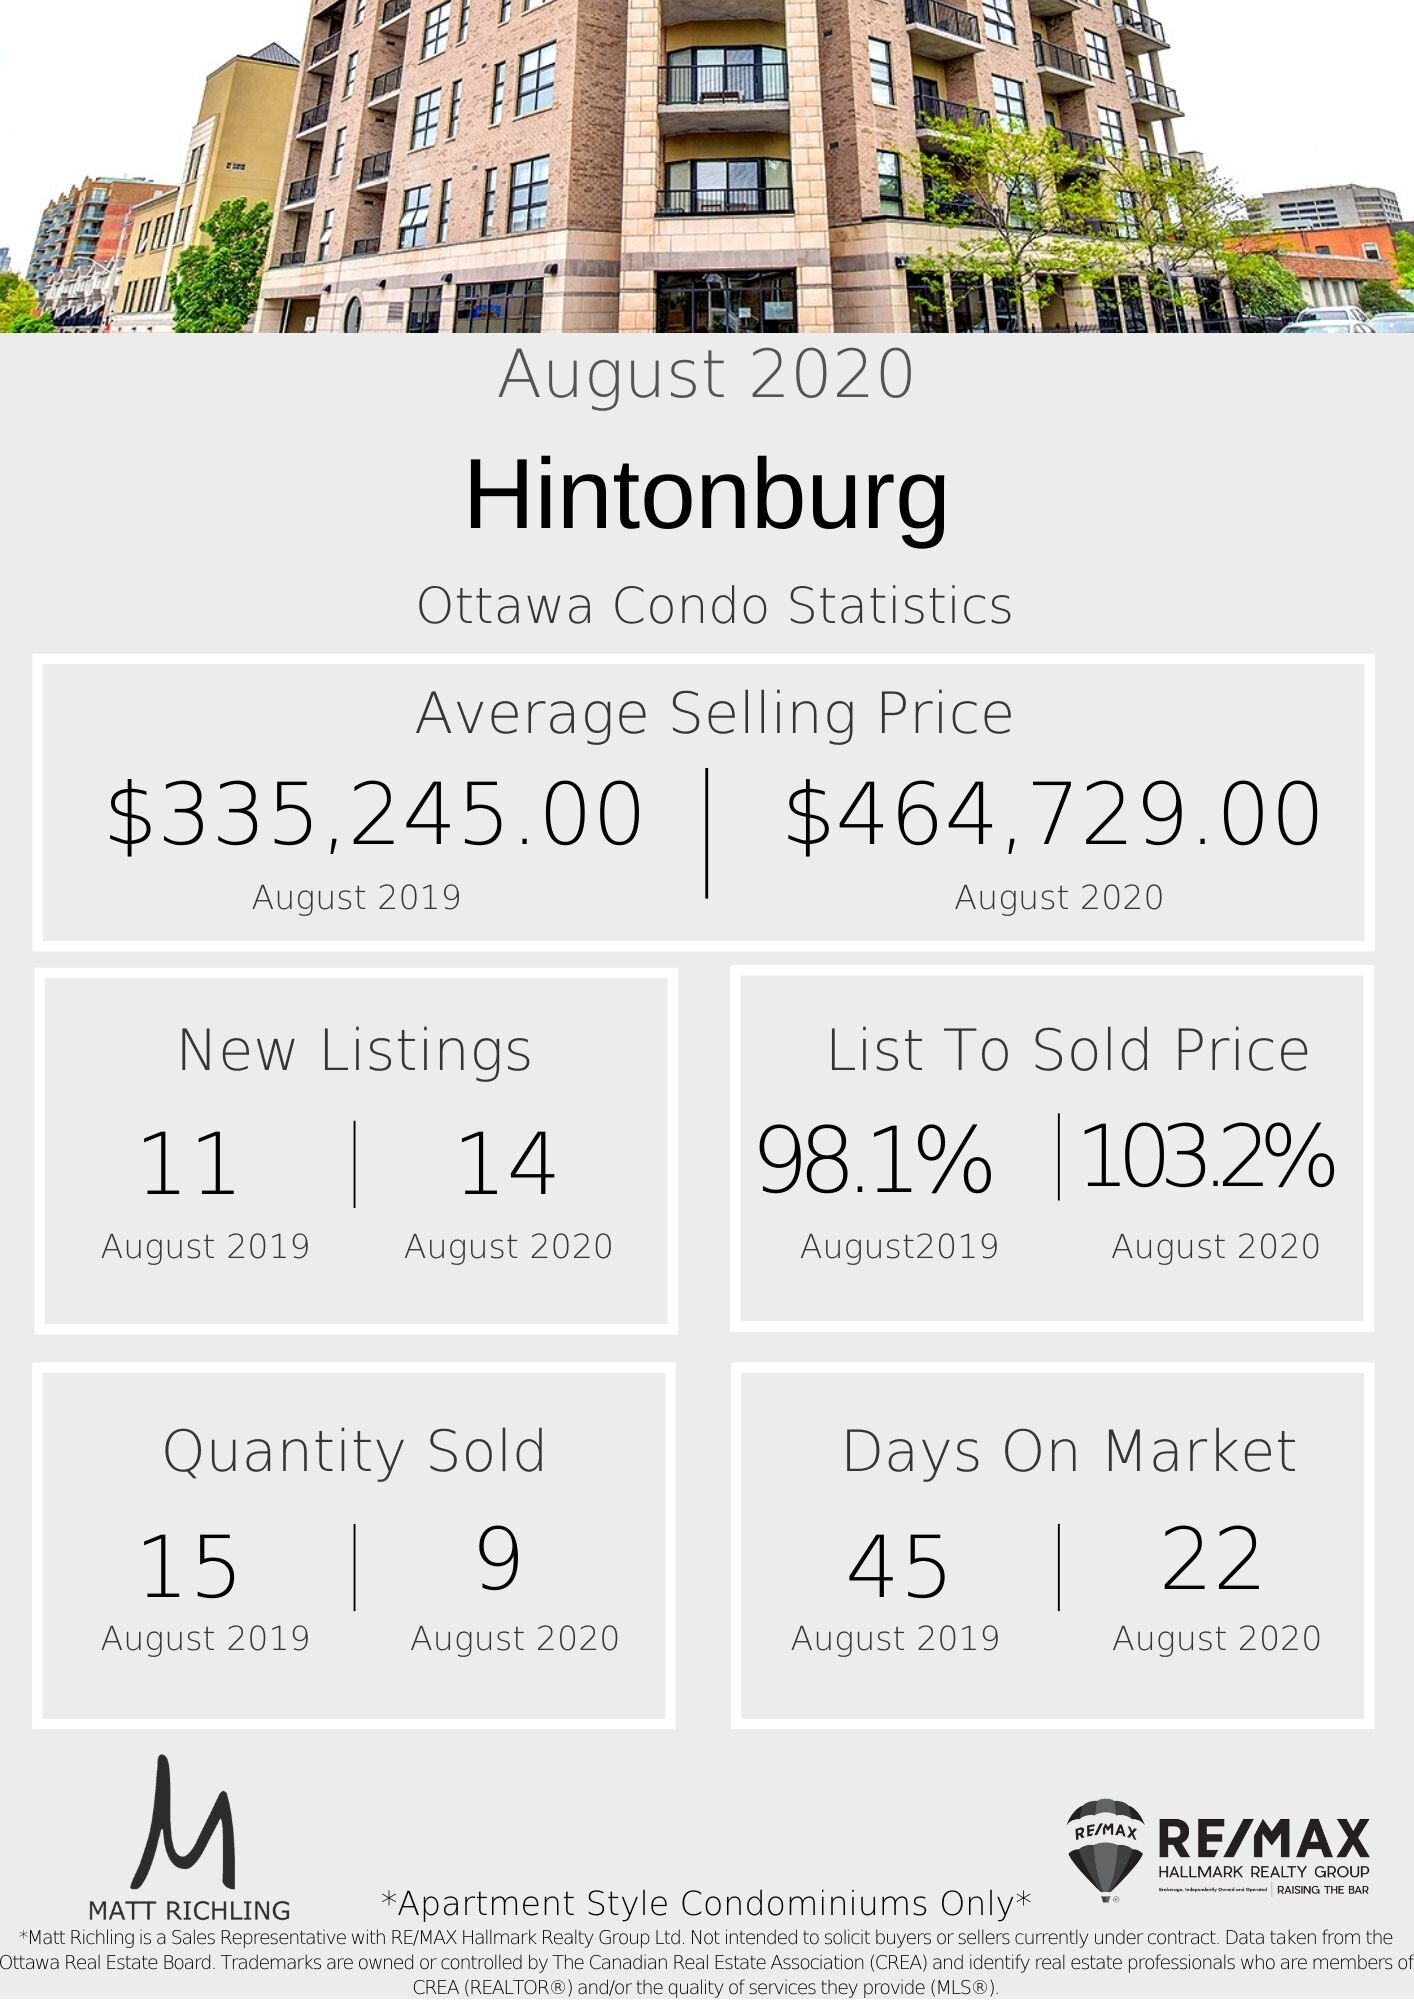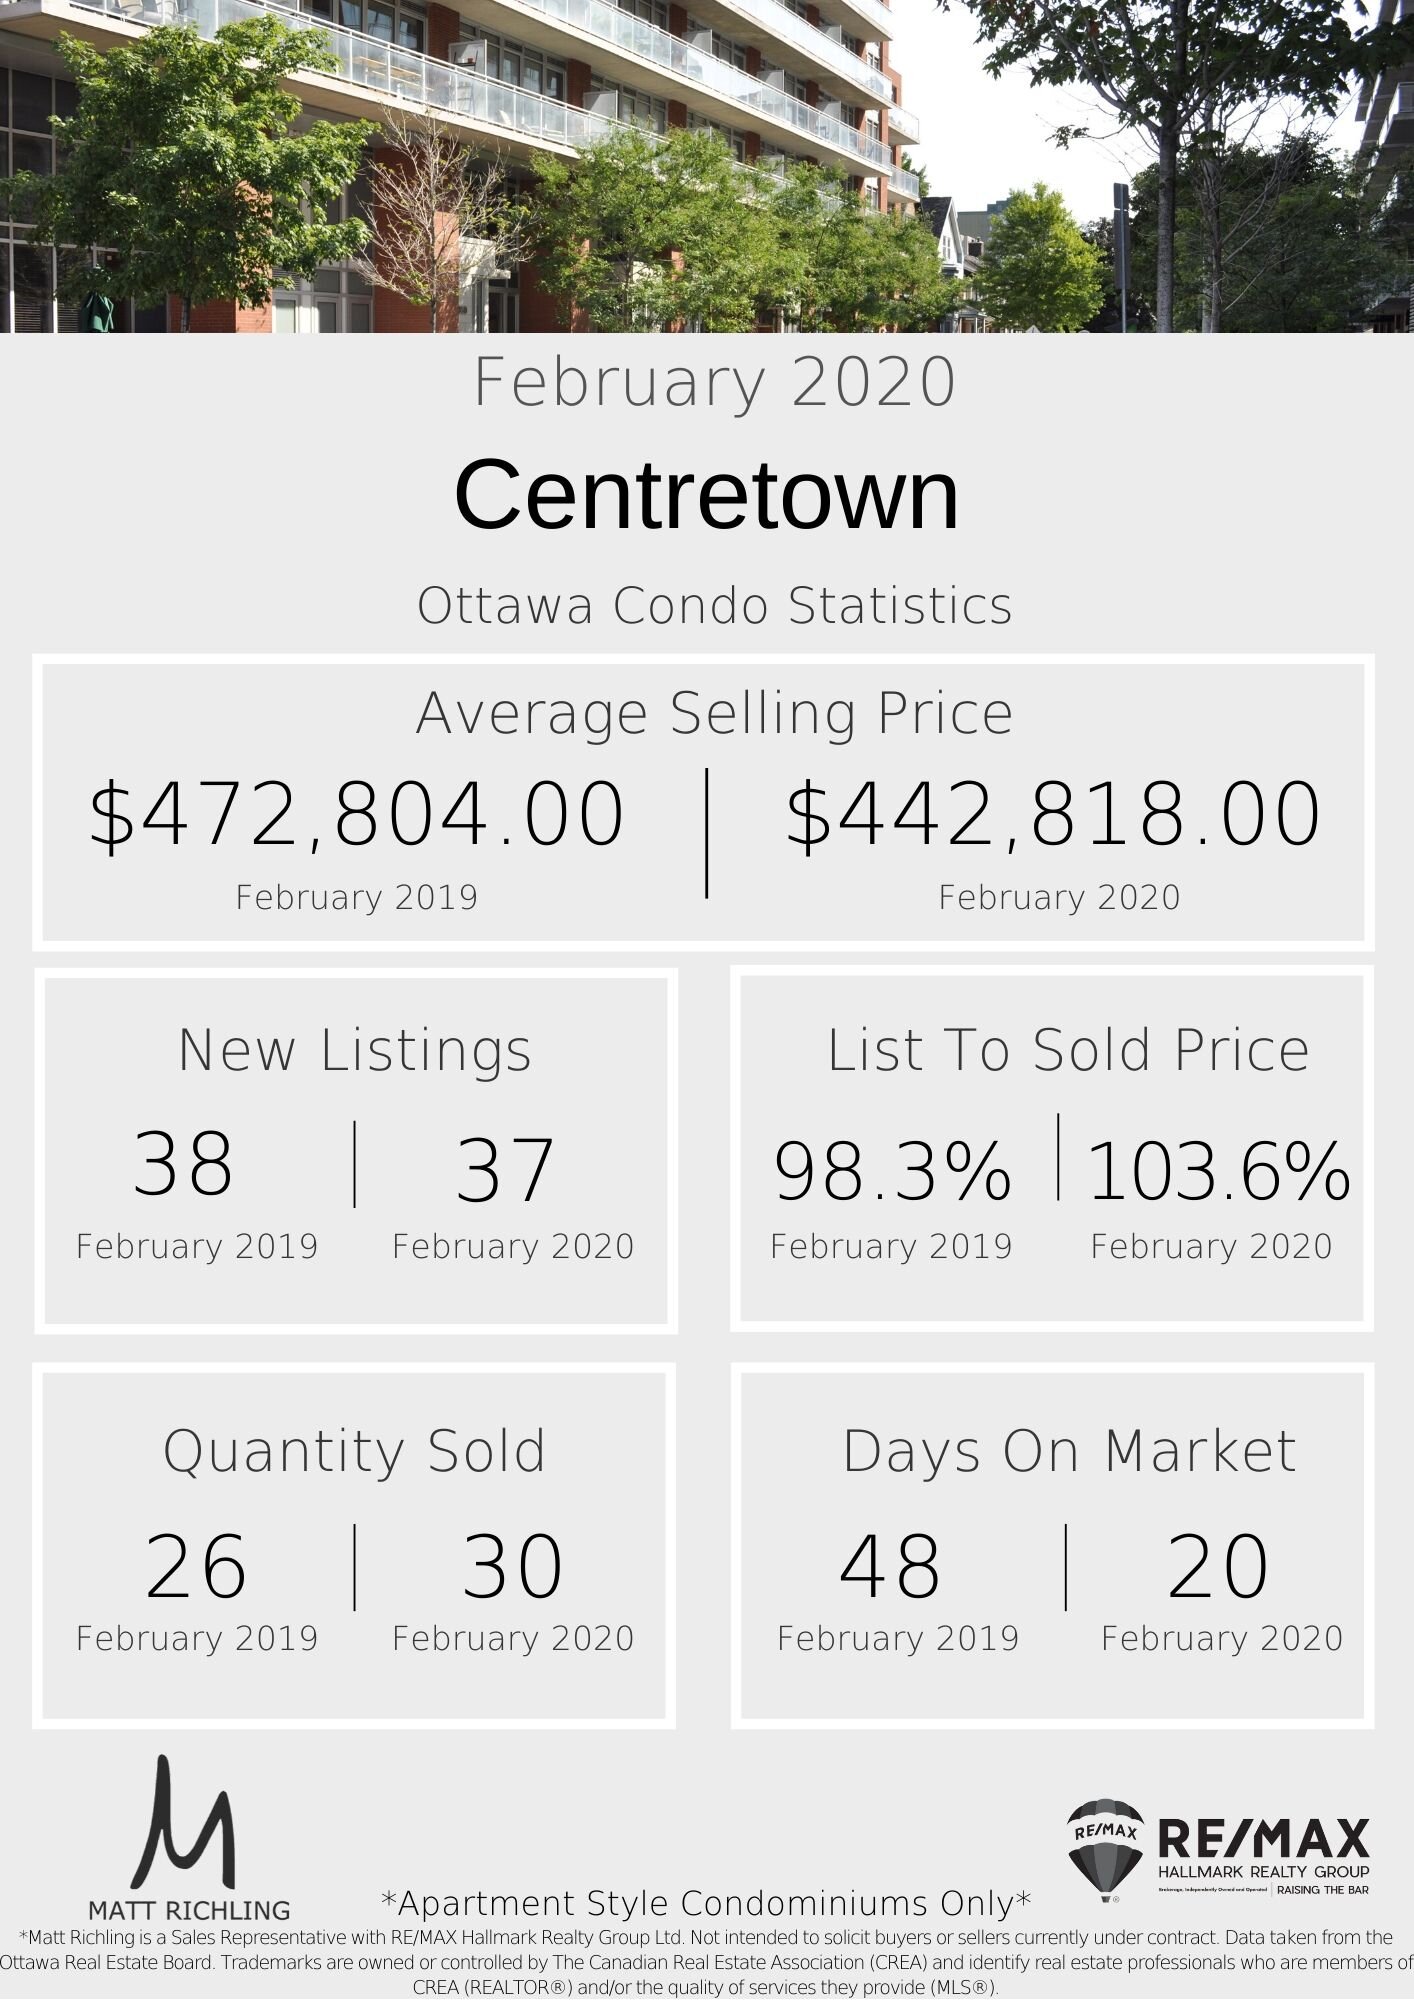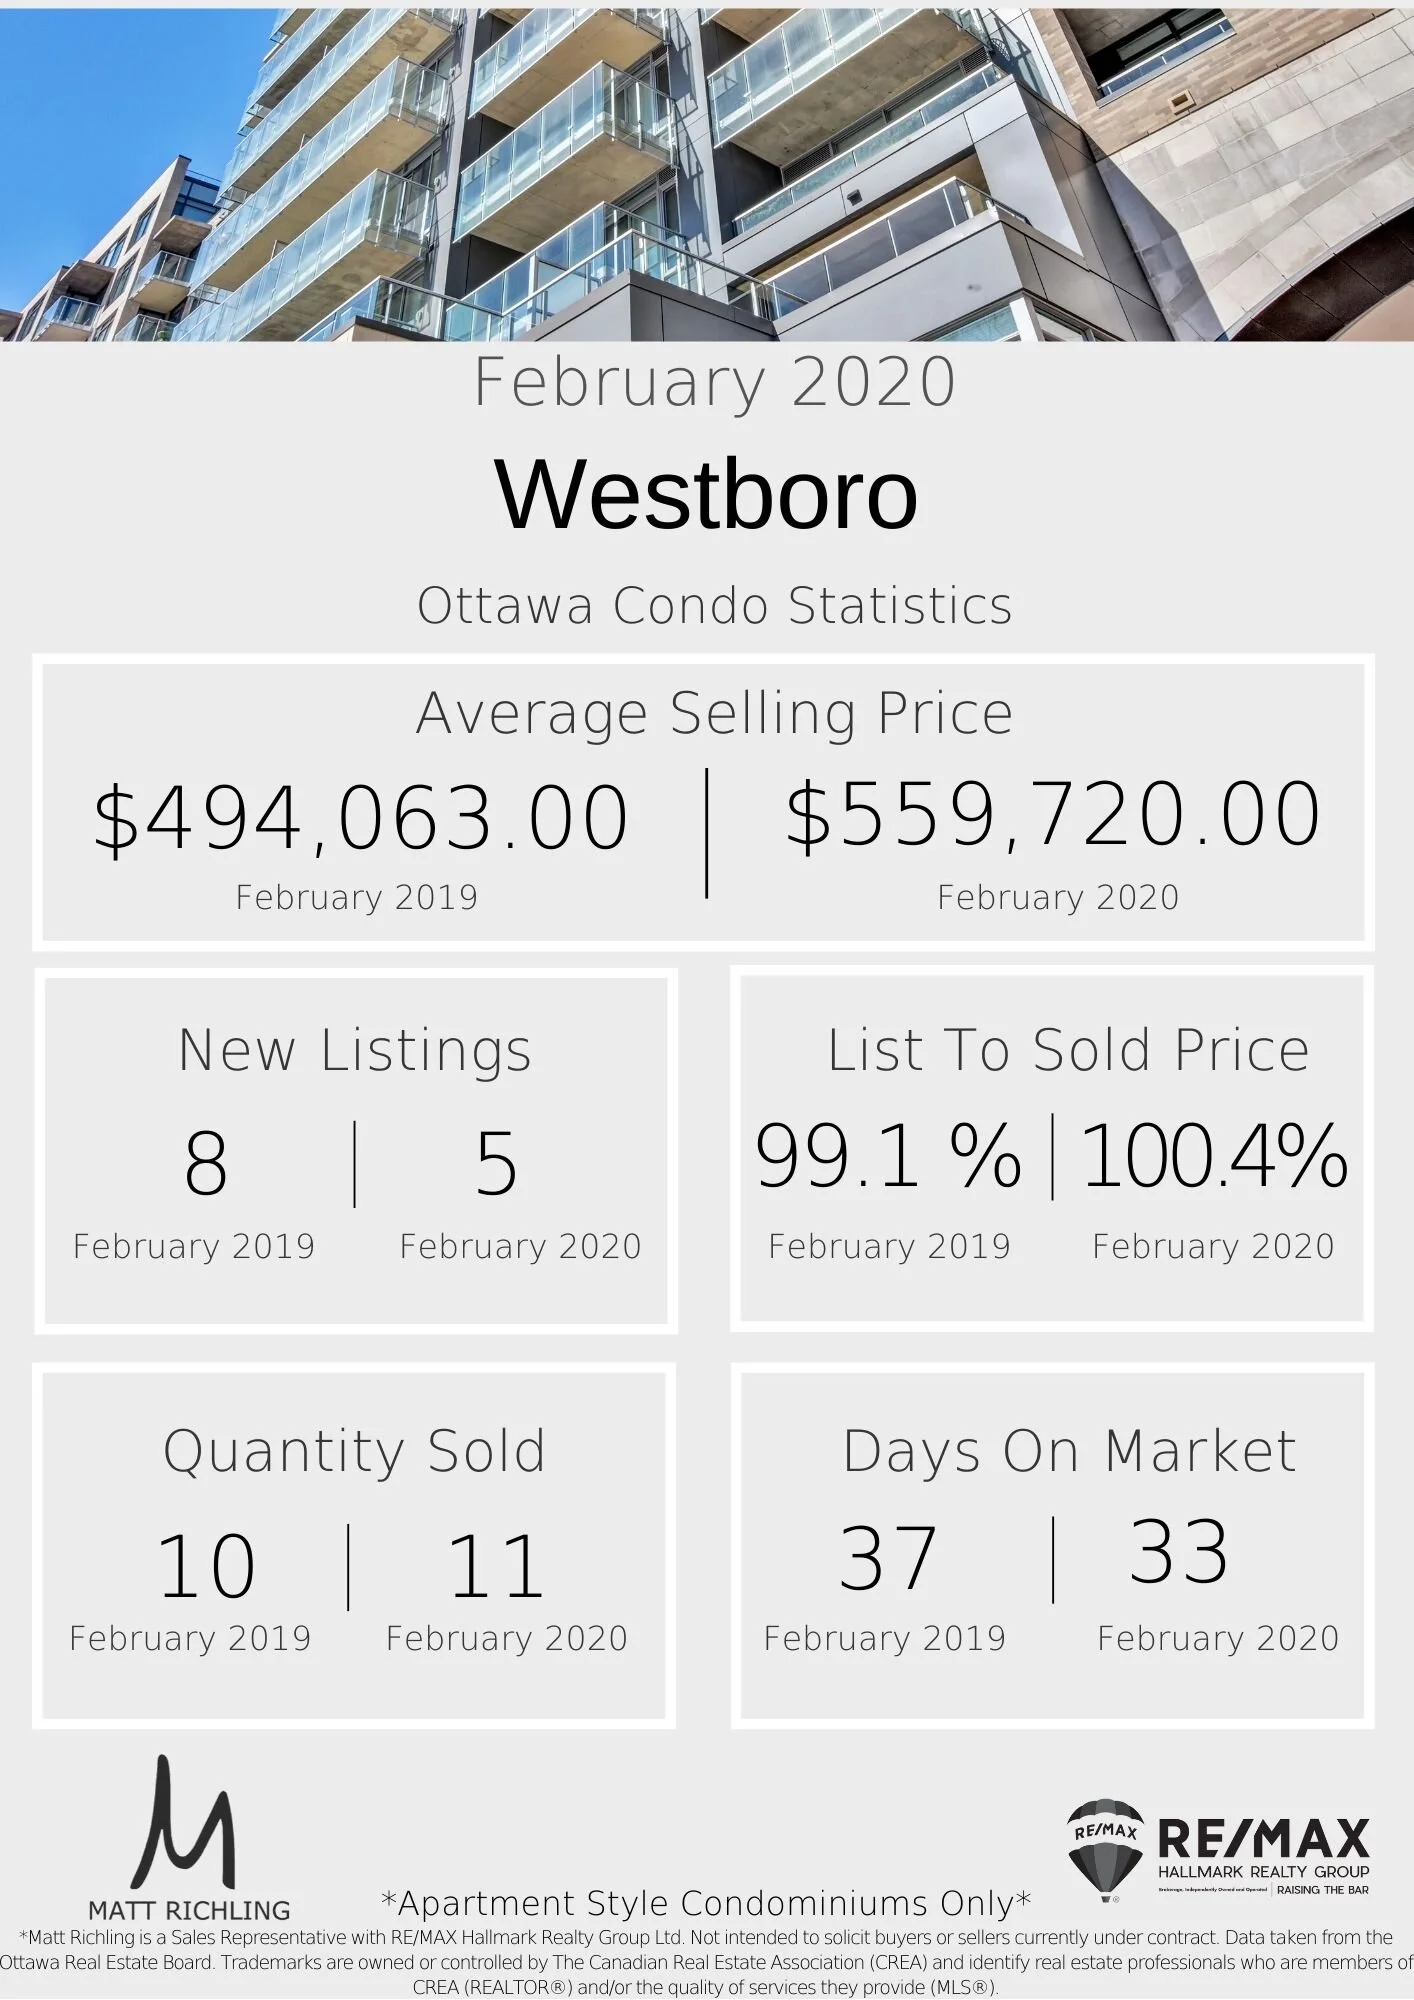
Every month we take a closer look and drill down the sales data of Ottawa condos from the previous month. Here are the statistics for August ‘21 in the top five "downtown" areas - Centretown, Byward Market and Sandyhill, Little Italy (which includes Lebreton Flats), Hintonburg, and Westboro. The information will be specific to apartment-style condominiums, and only what sold through the MLS. Also important to note that DOM (Day's On Market) is calculated to include the conditional period, which in Ottawa is almost every single transaction to be roughly 14 days.
Traditionally speaking, August is one of those months that gives everyone a break between the spring and fall craziness. Last year, this was thrown out the window due to covid, but this year we are starting to get back to a more normal market expectation. Usually, when I am writing these I am also looking at last month’s numbers to help compare not only year-over-year but month-to-month. CLICK HERE For July 2021 stats. One thing we easily noticed was that every area saw - month over month - a decrease in the average selling price, lower list to sold price, and more days on market (with the exception of Westboro - which still saw a lower list to sold price ratio). Nothing dramatic, but exactly what we were expecting going into the month.
I asked Husnain Ali - to break down what he is seeing in the market right now. “Right now I am seeing more inventory on market, less holding off of offers, multiple offers are less common but still prevalent. Certainly seeing a larger buyer pool than the last couple months, and we are moving more towards a more balanced market”
Spoke with Aly Ball for her take. “The market after a slight lull in August has started to strengthen and we are seeing multiple offers again. Prices are holding strong.”
Want to chat about your options? Fill out the form at the bottom of the page, or txt/call us directly 613-900-5700 or fill out the form at the bottom of the page.


Do you have any questions about how this information affects your investment or looking for more information to make the best decision about your purchase? Let’s chat! Fill out the form on the bottom of the page.