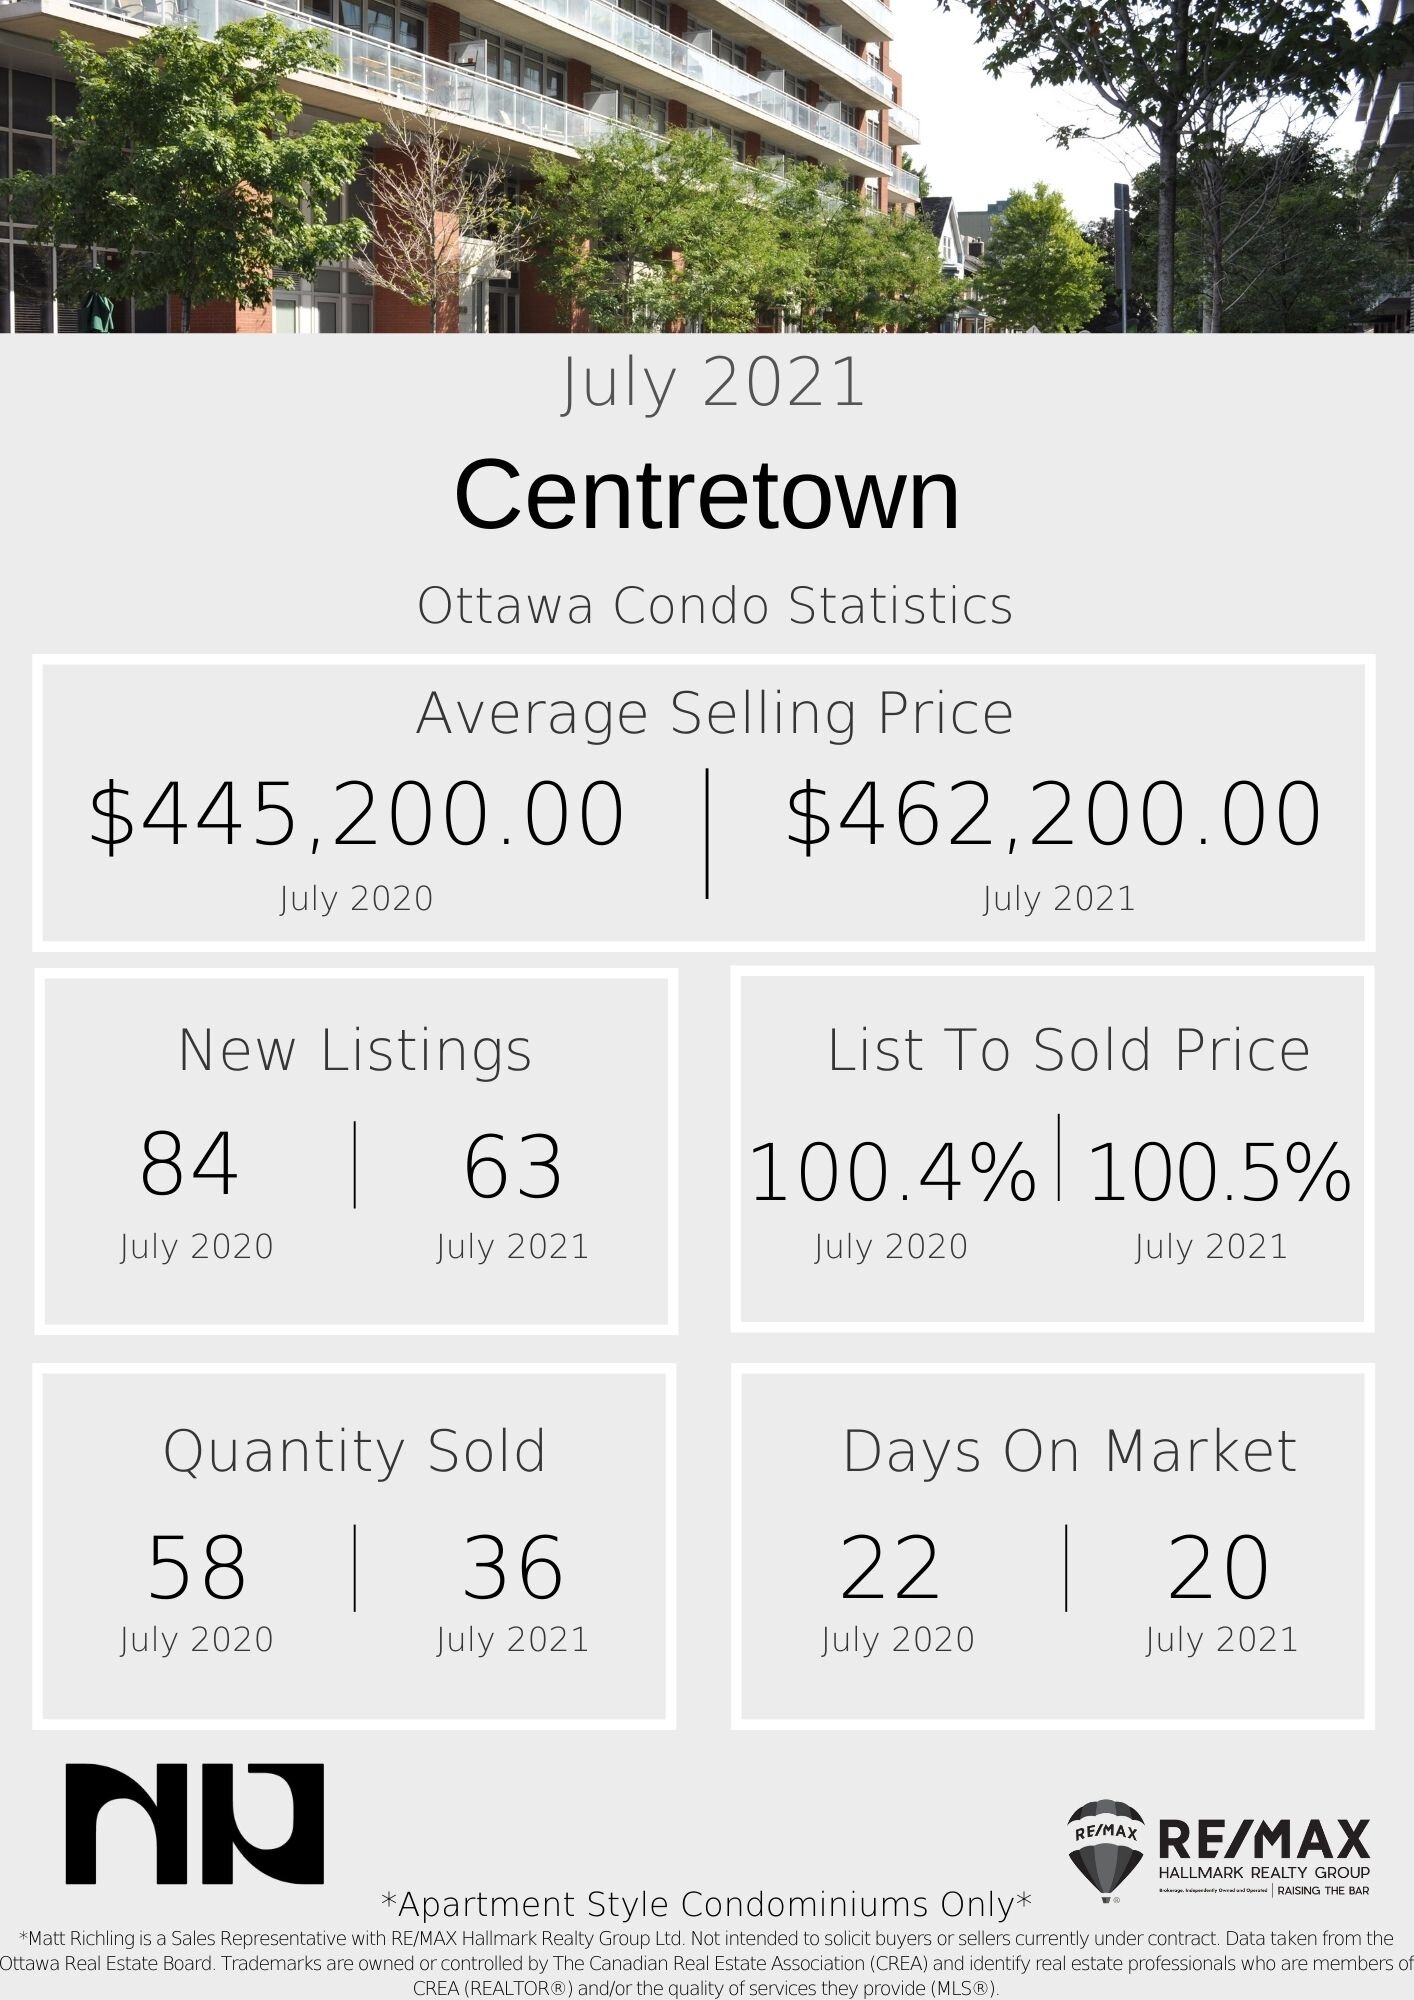
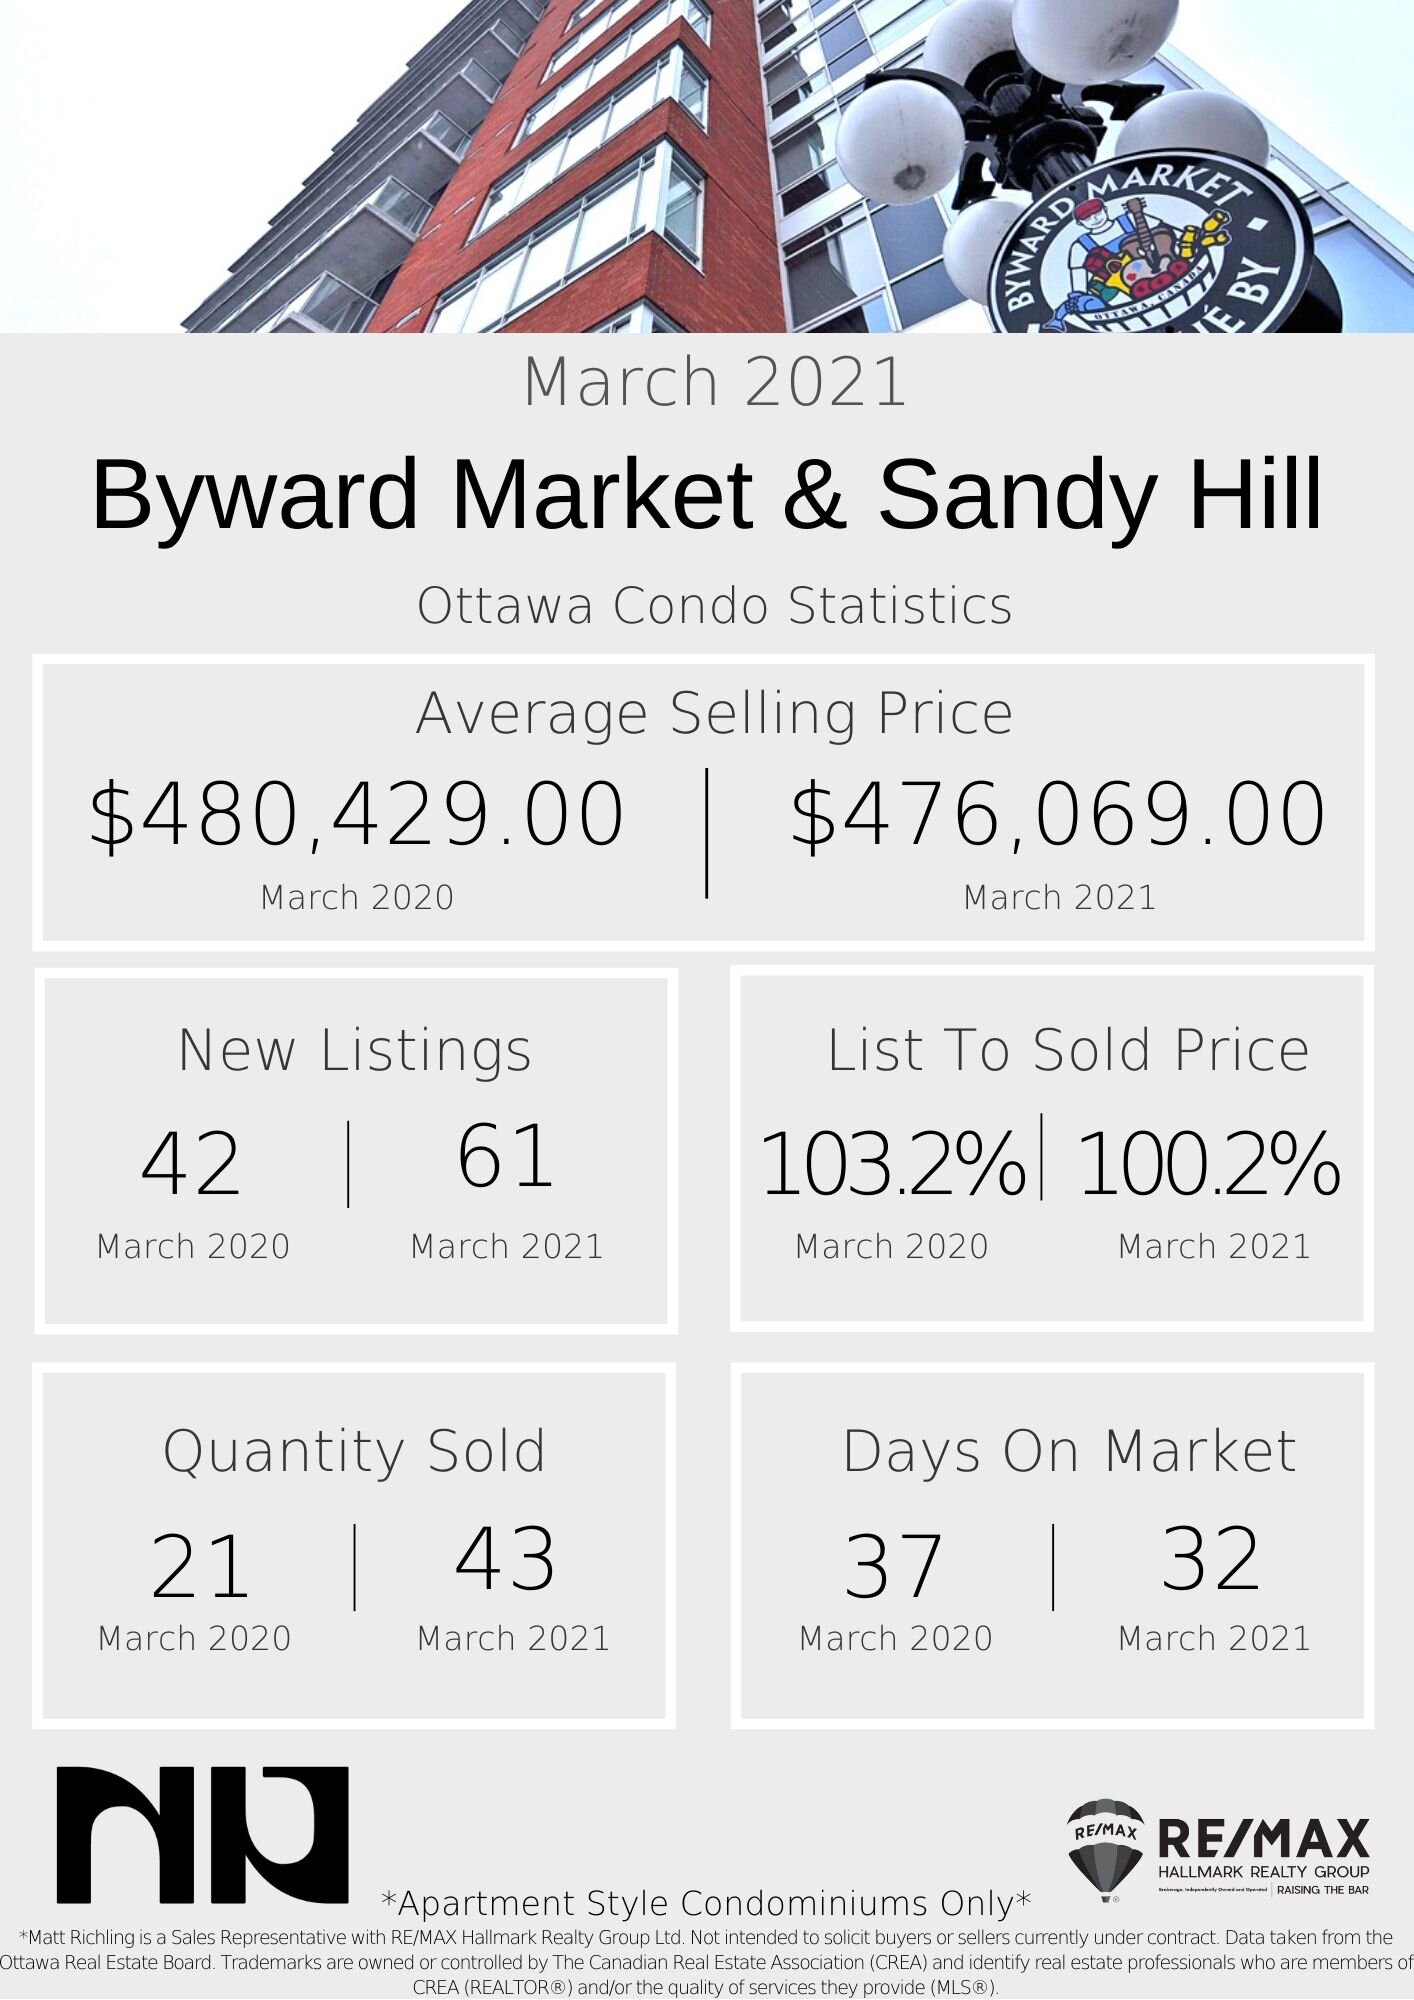
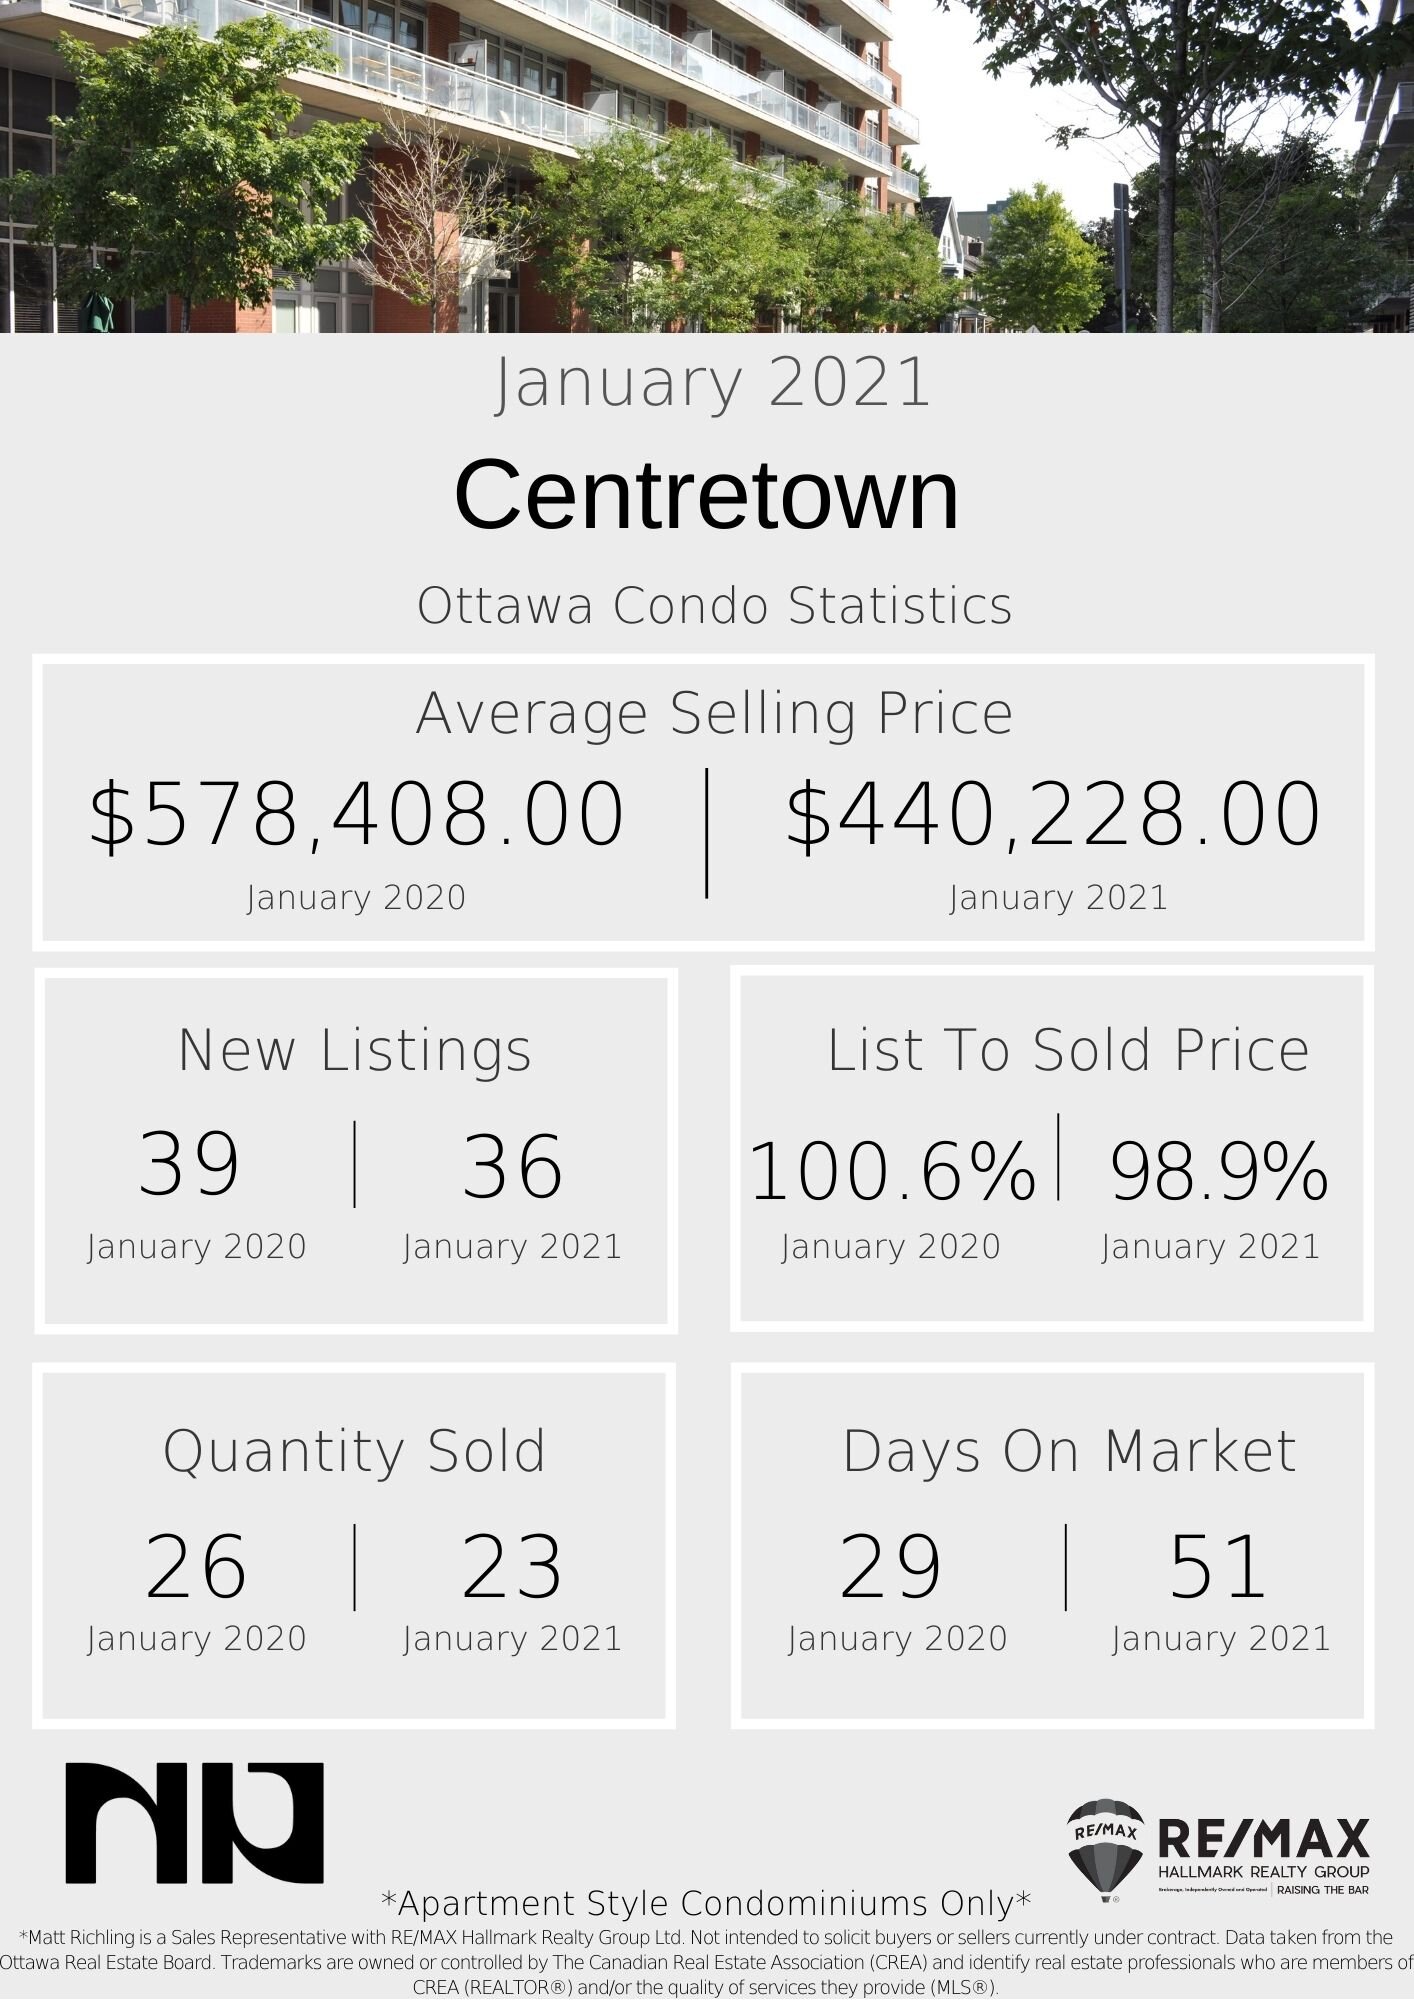
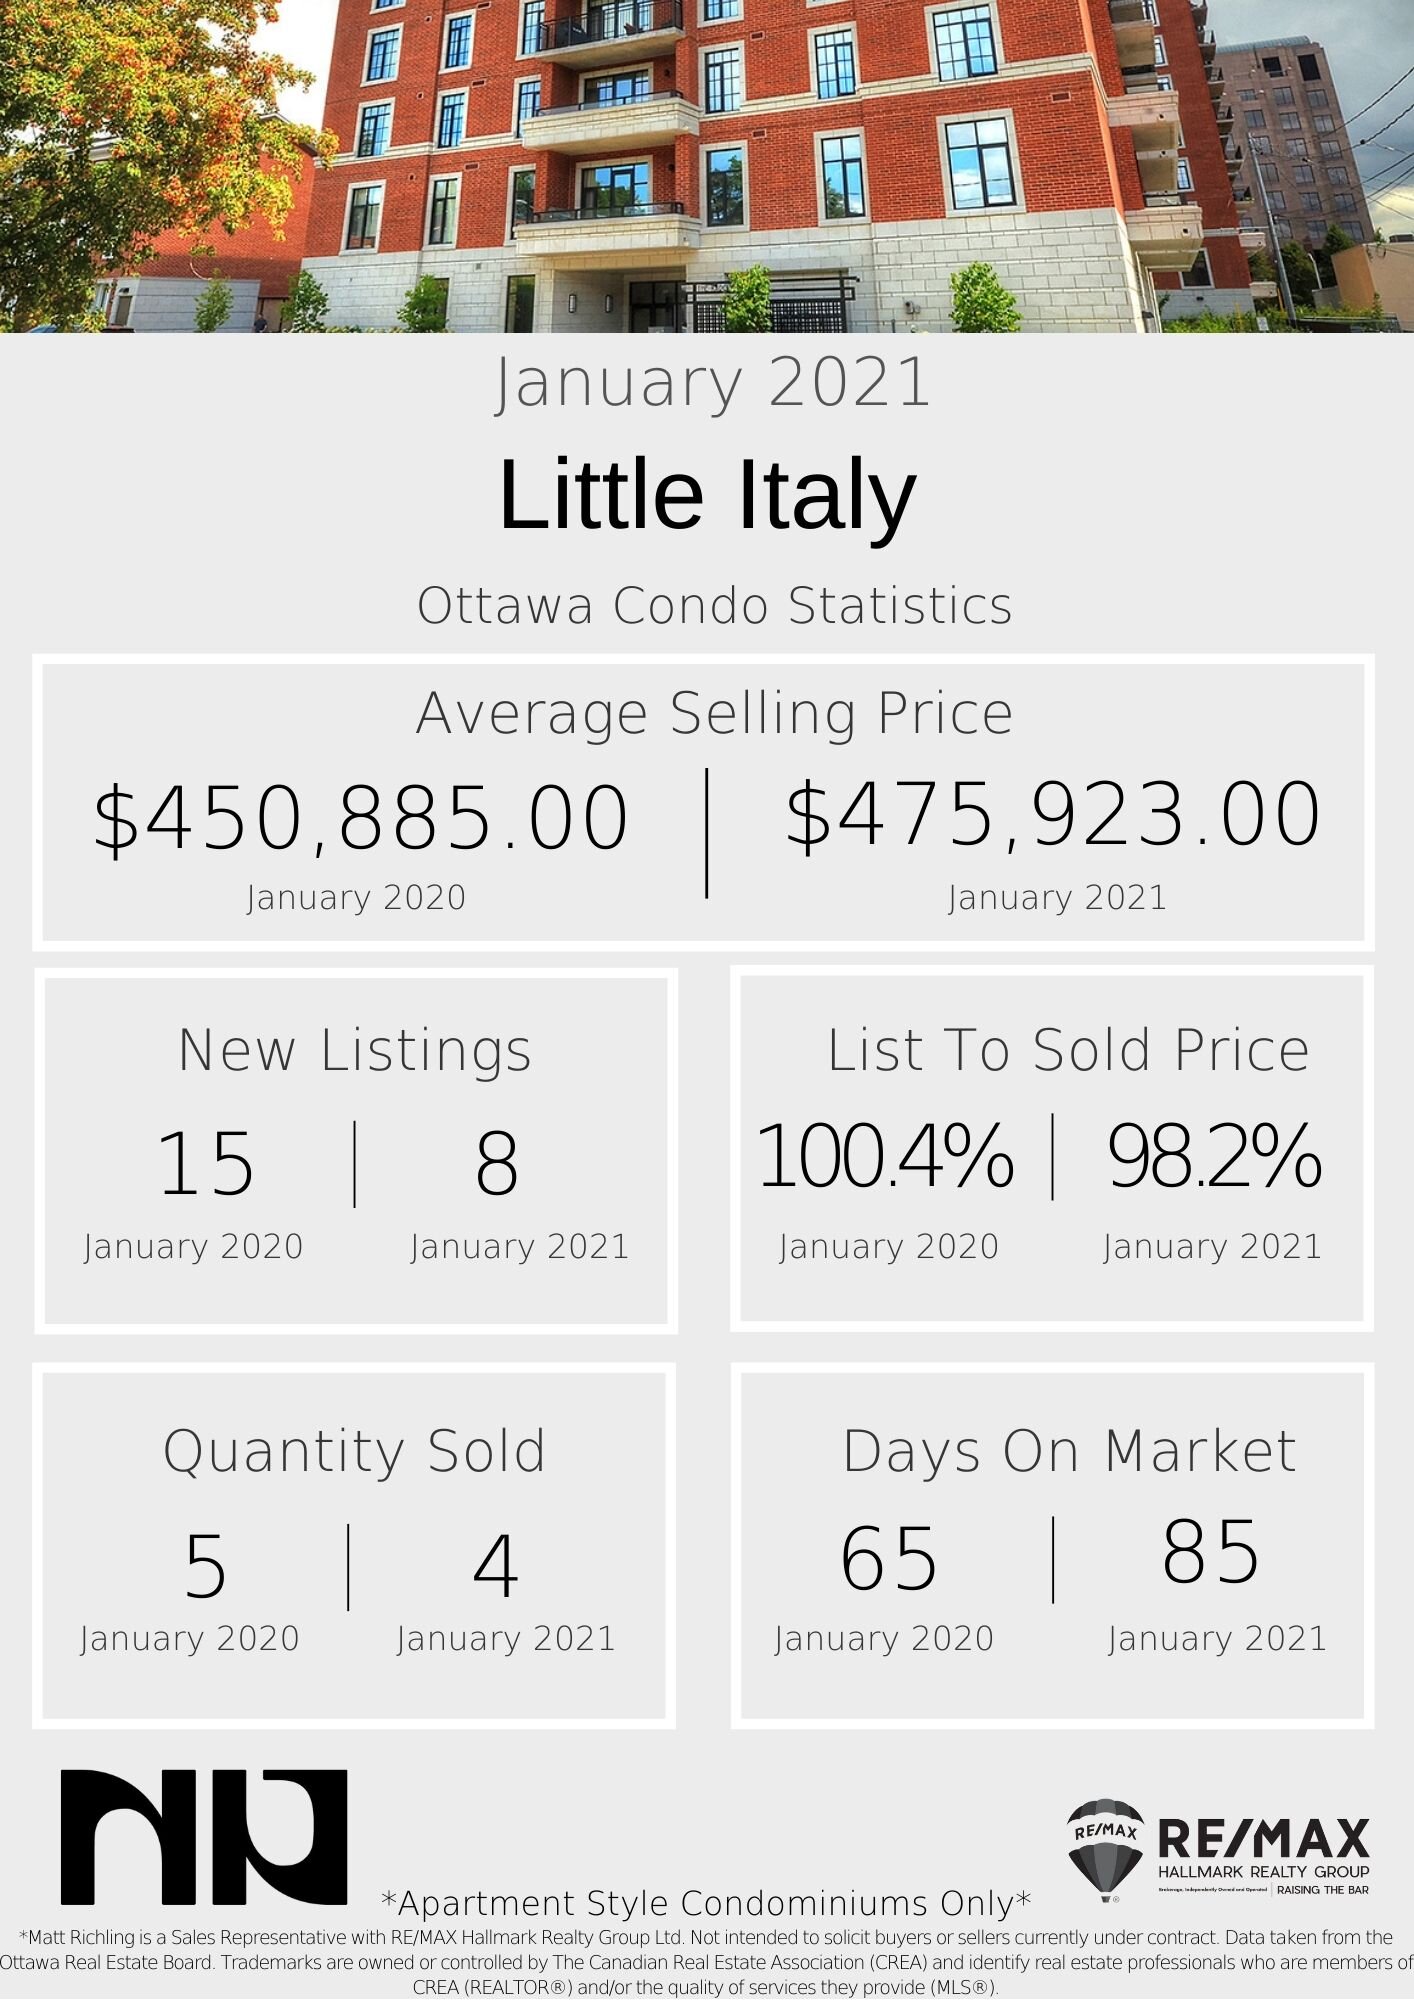
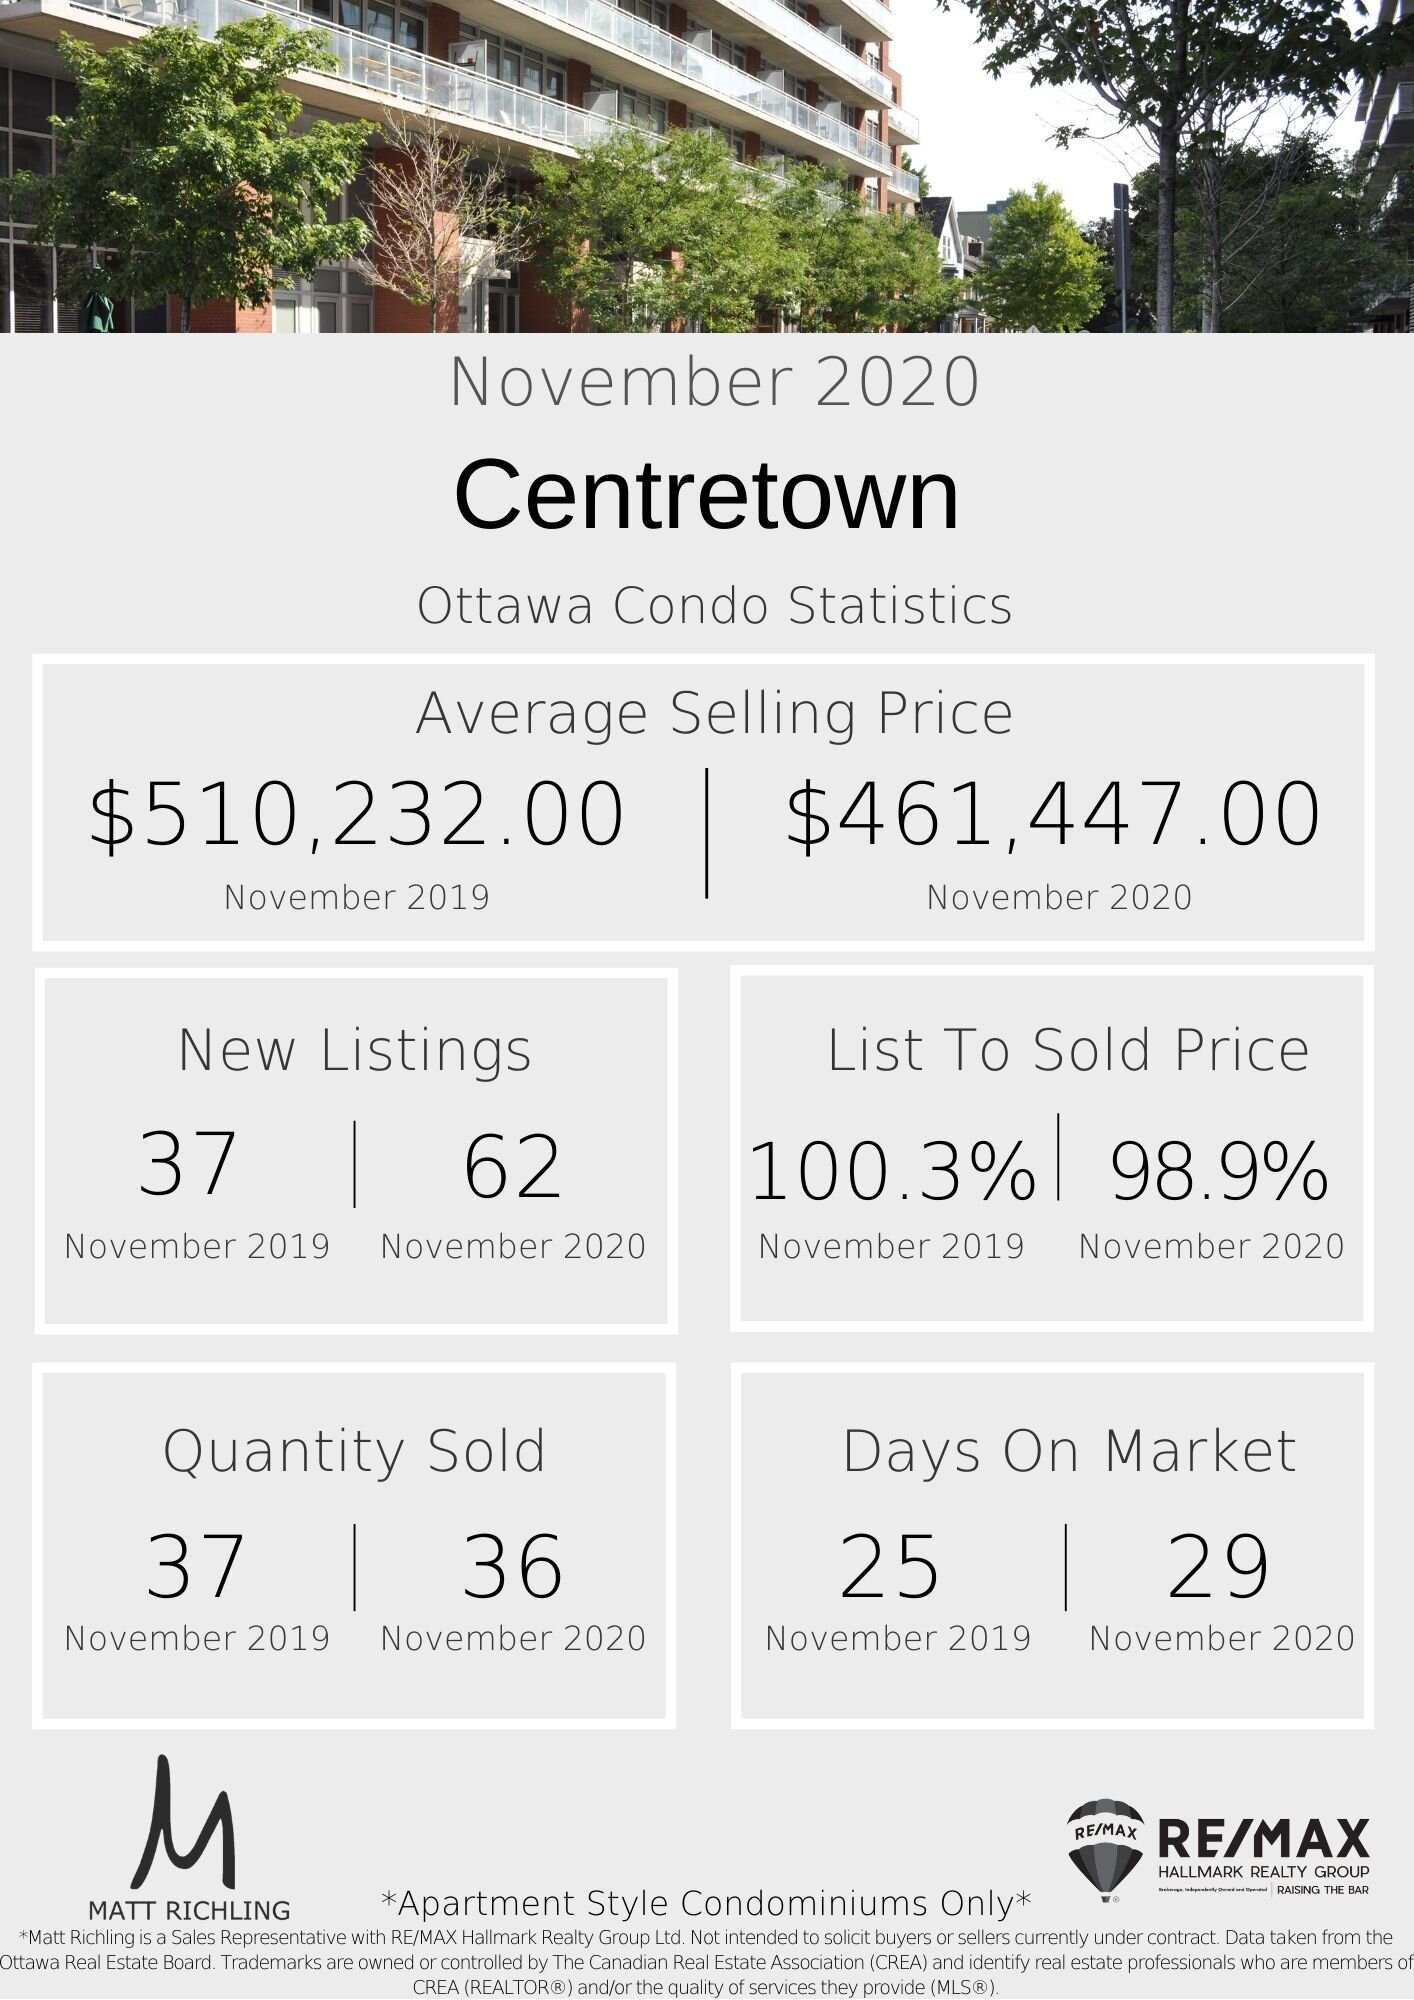
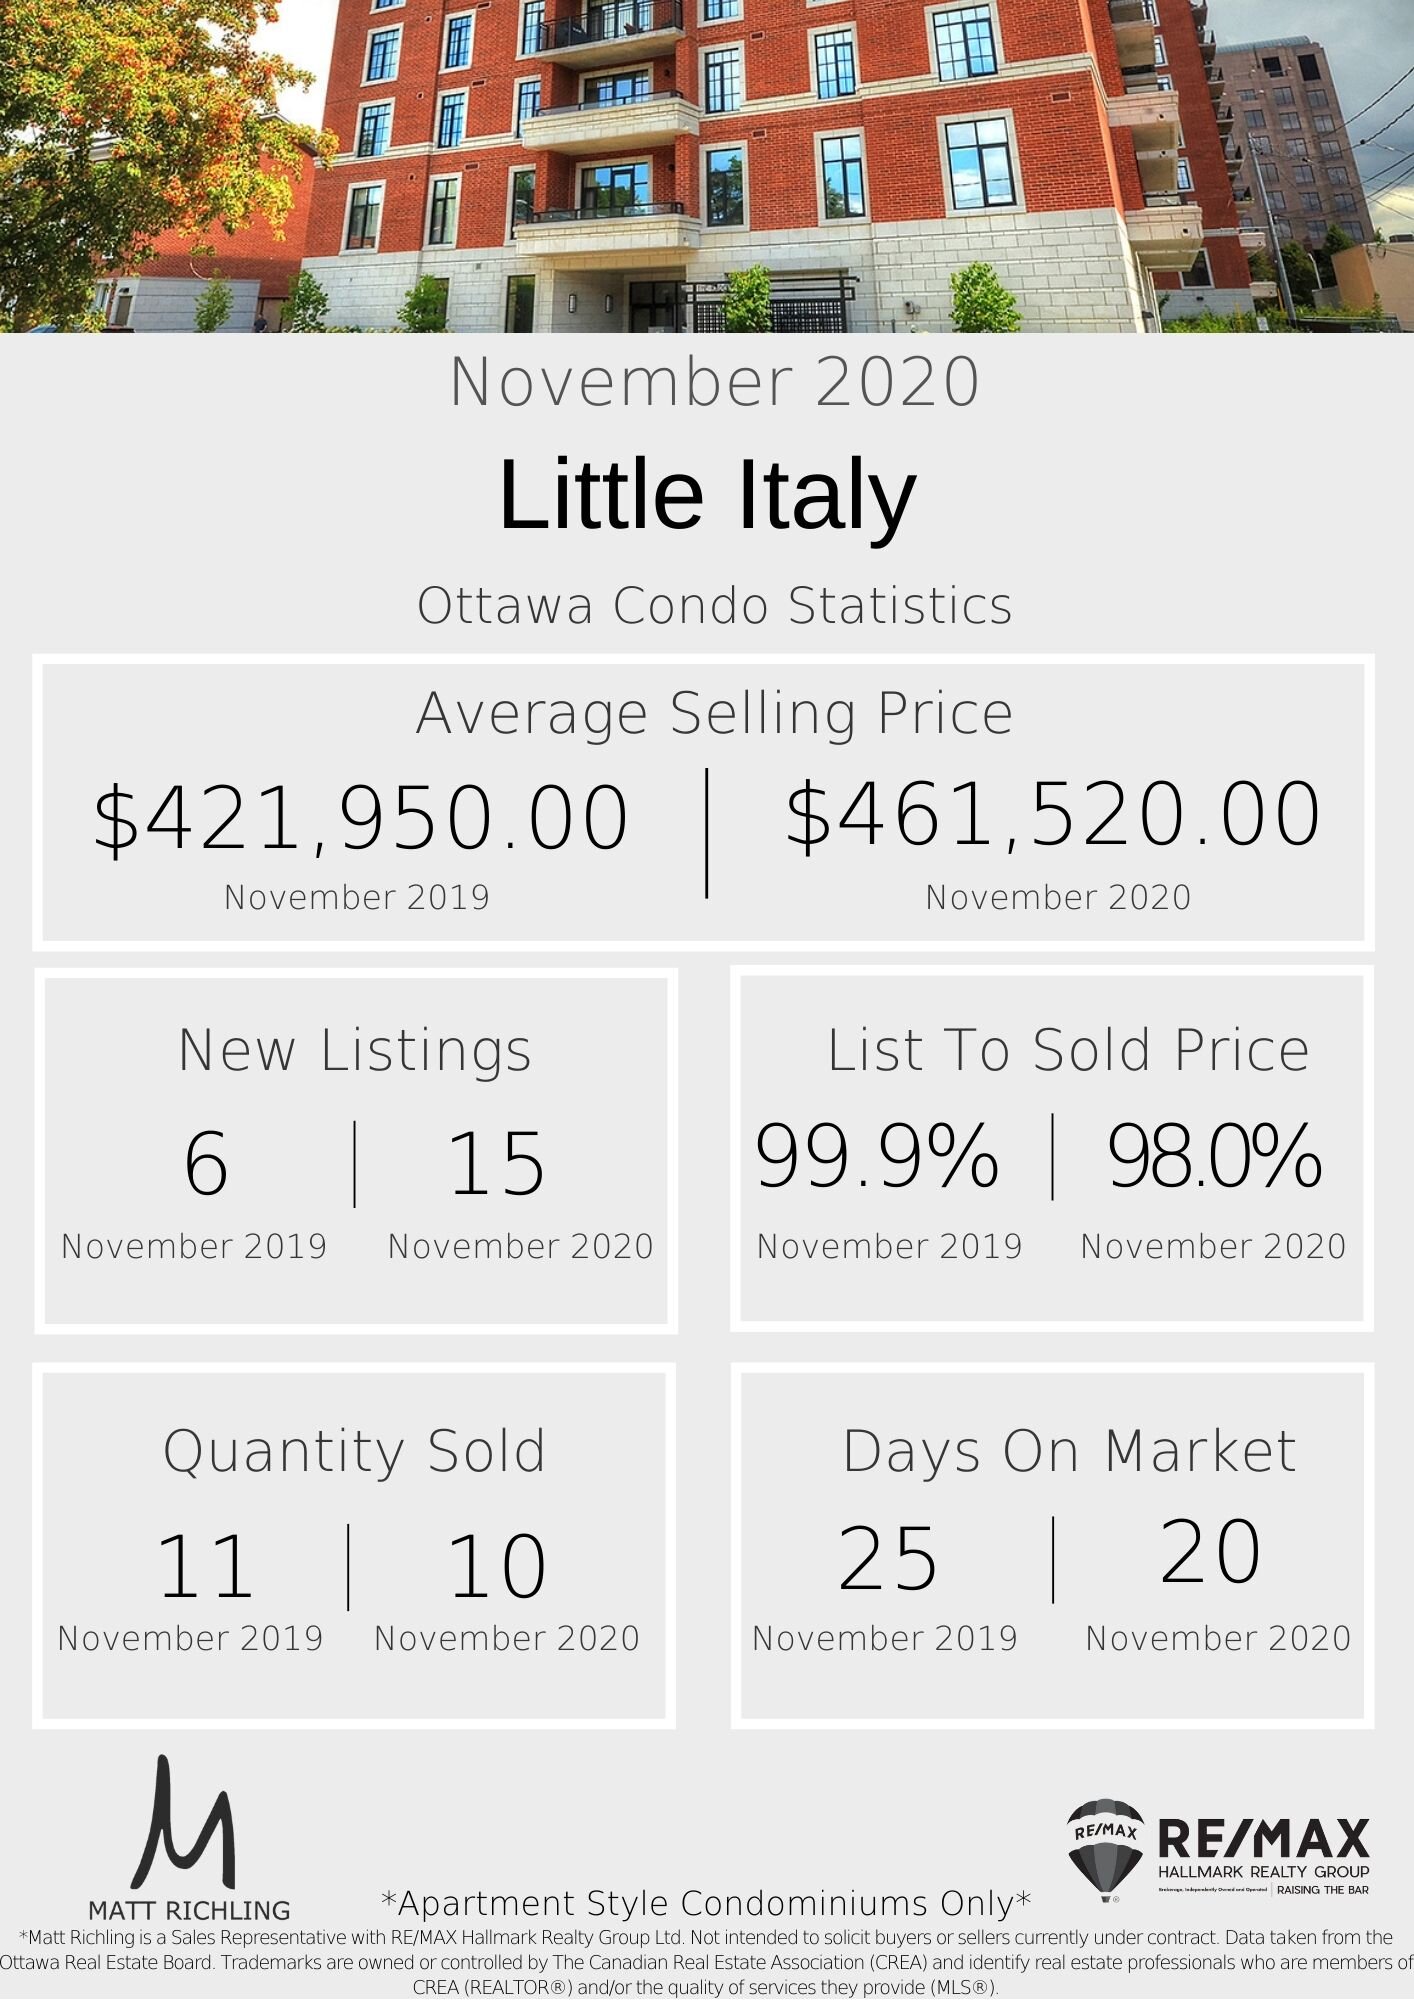
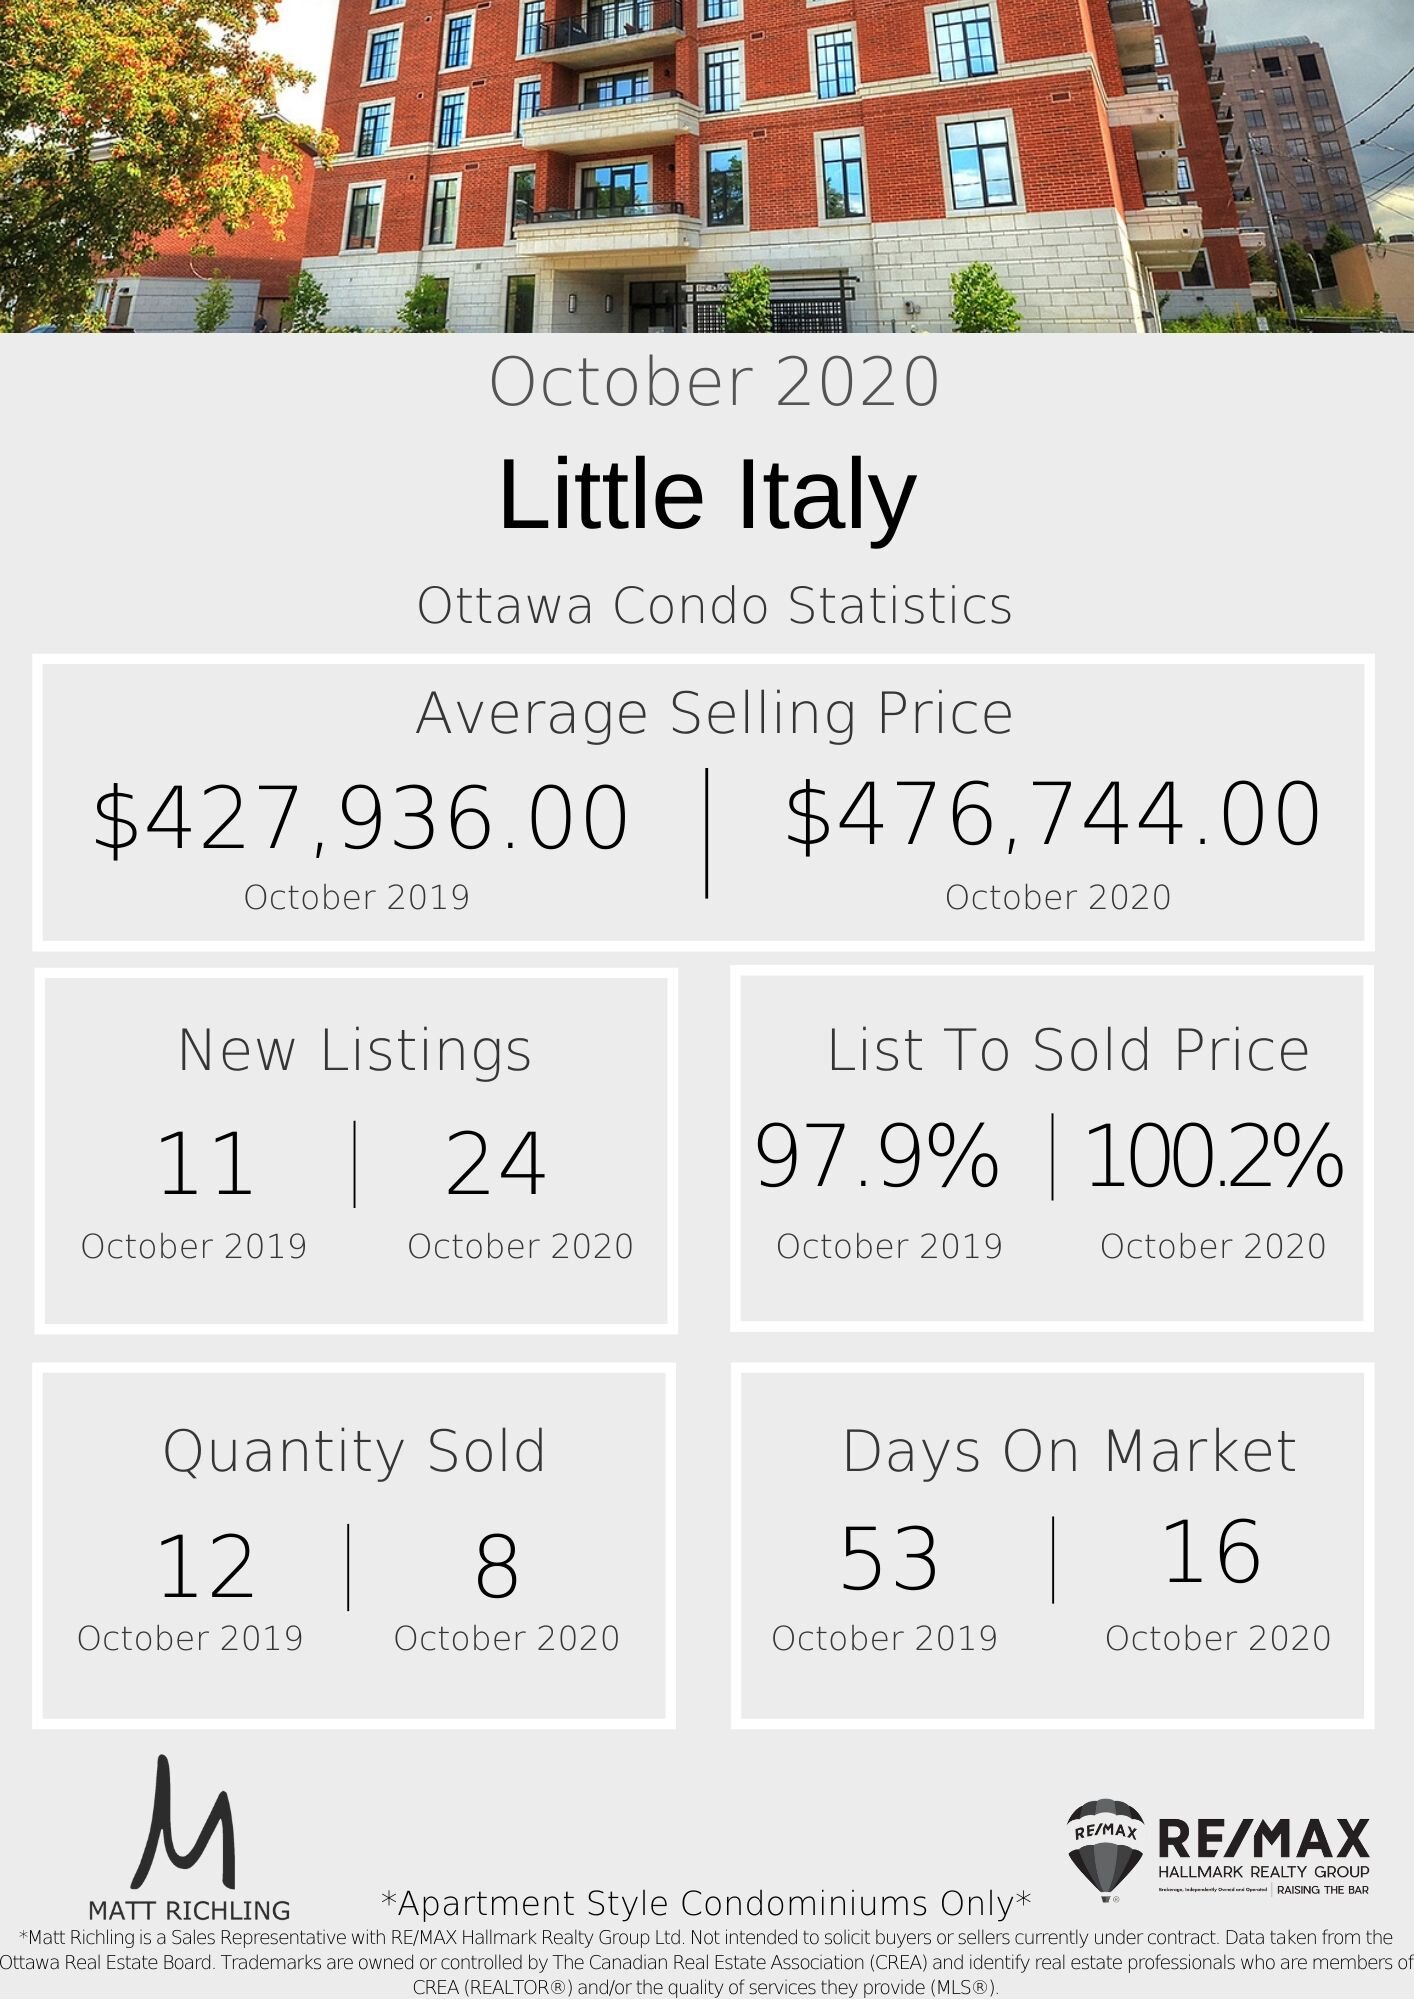
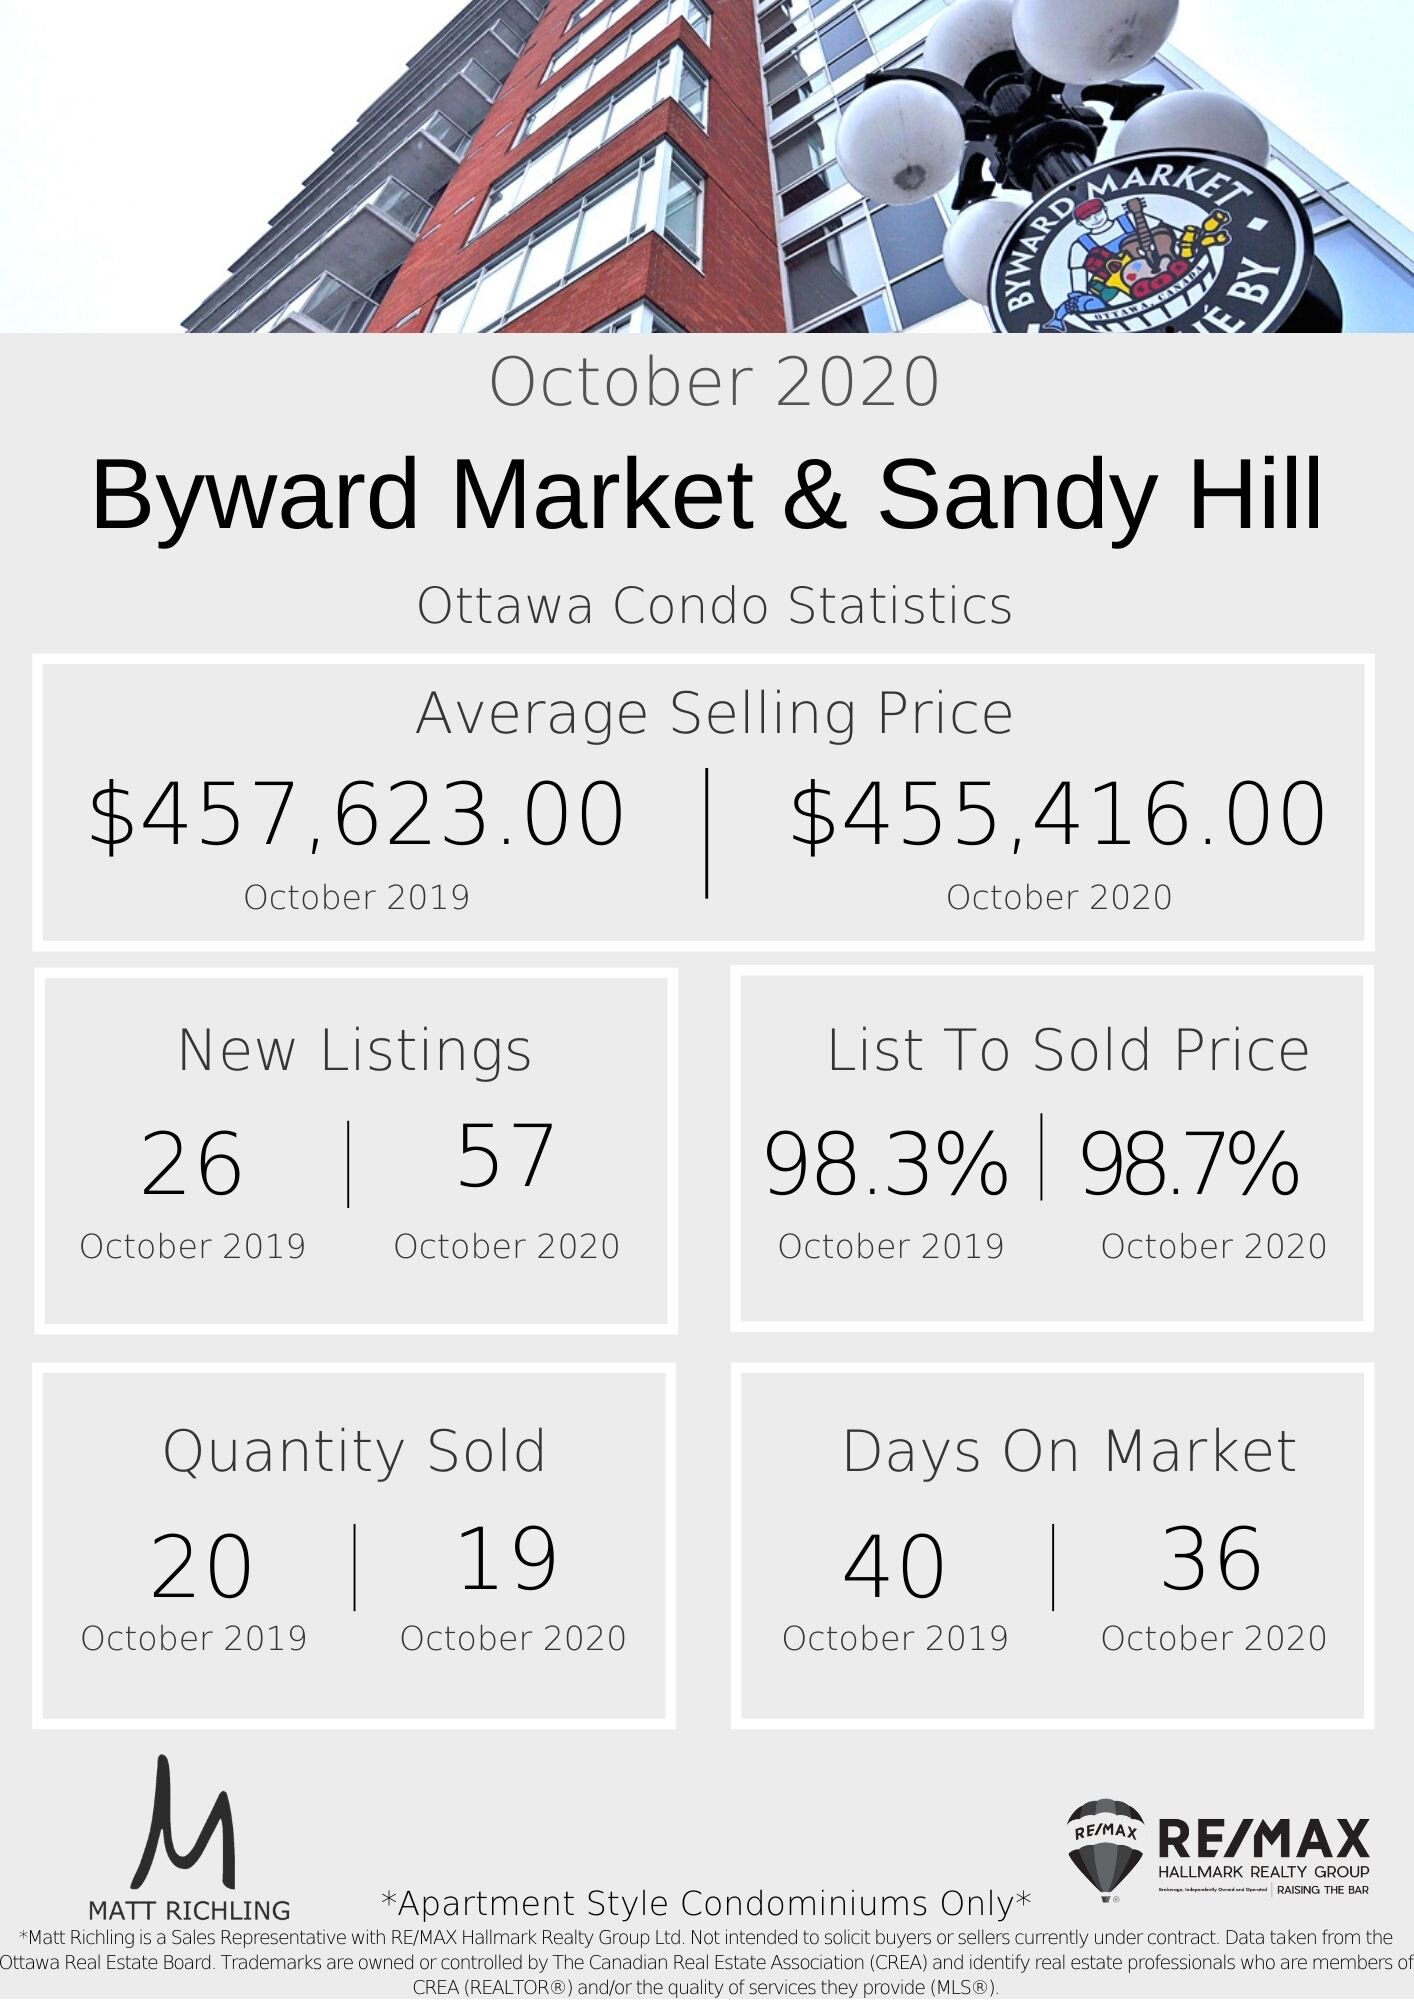
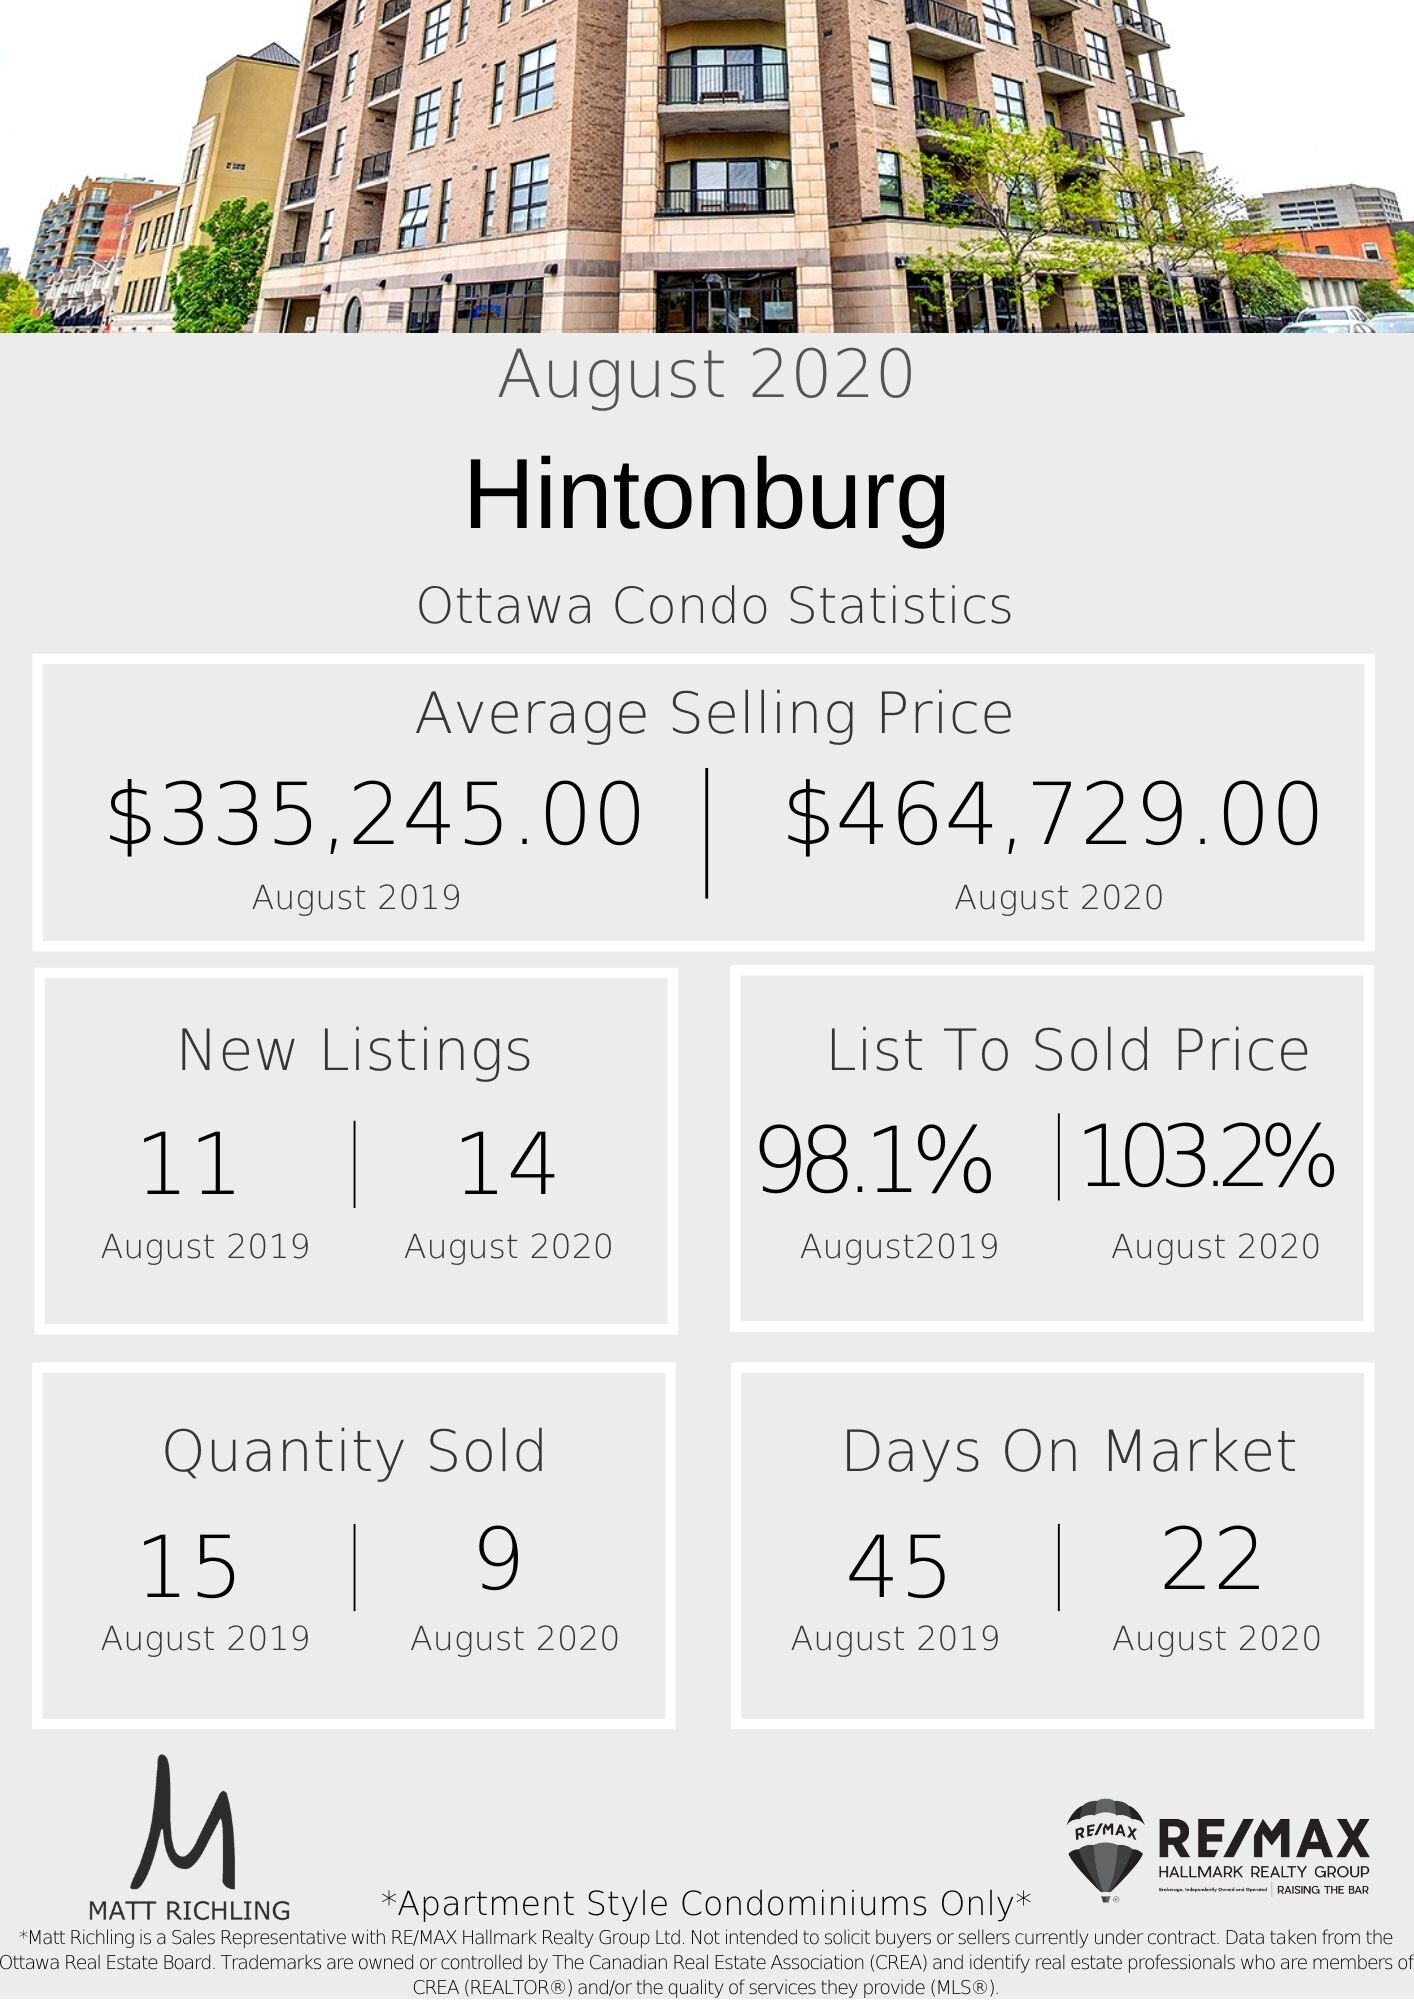
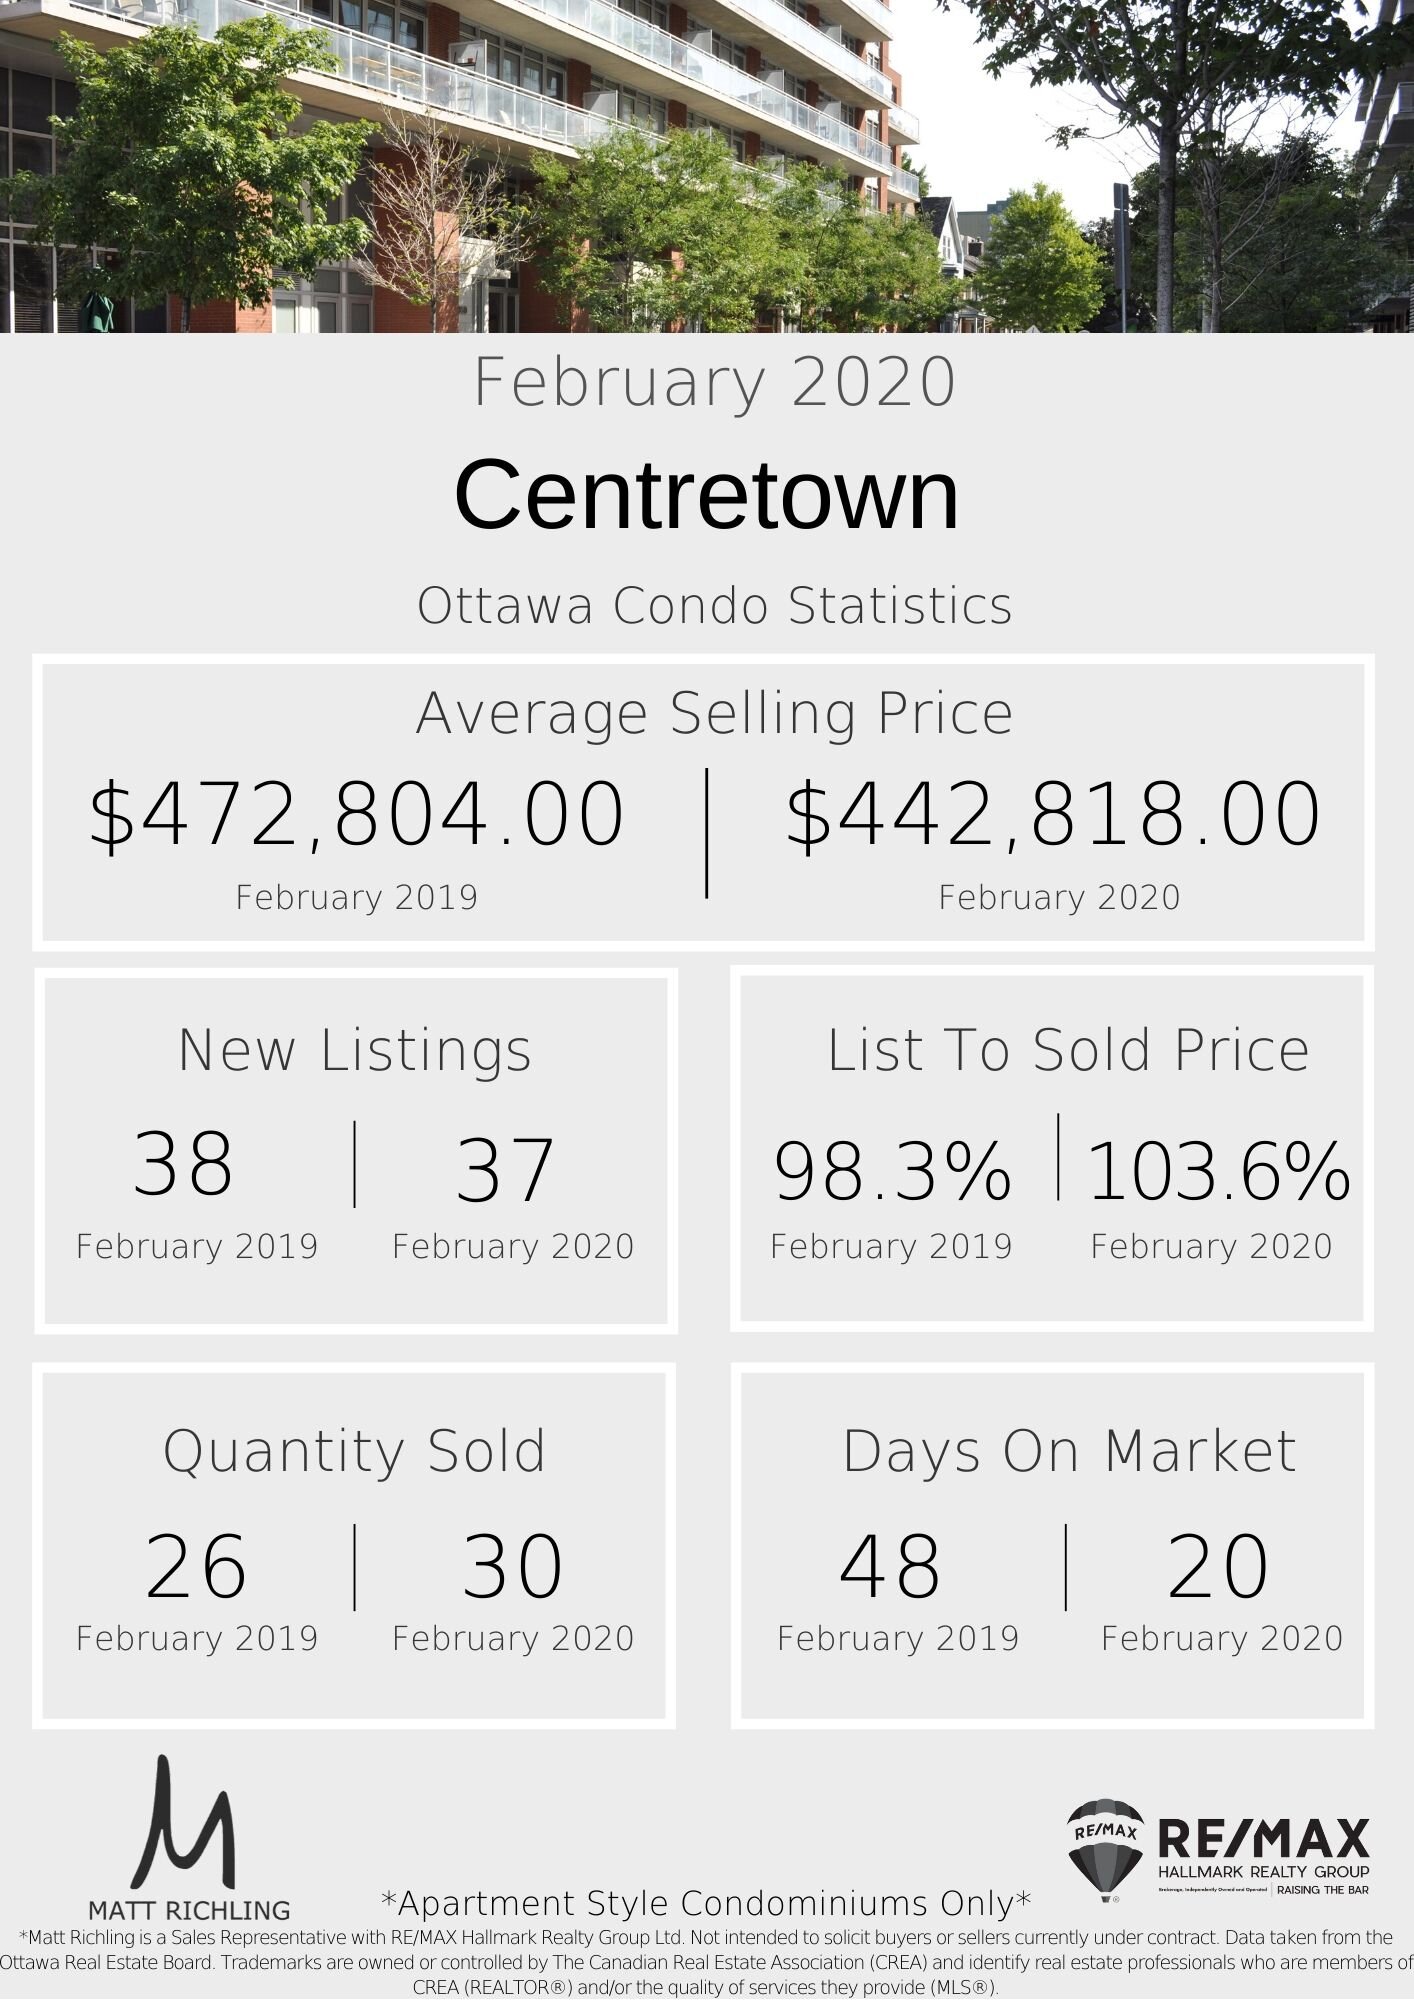
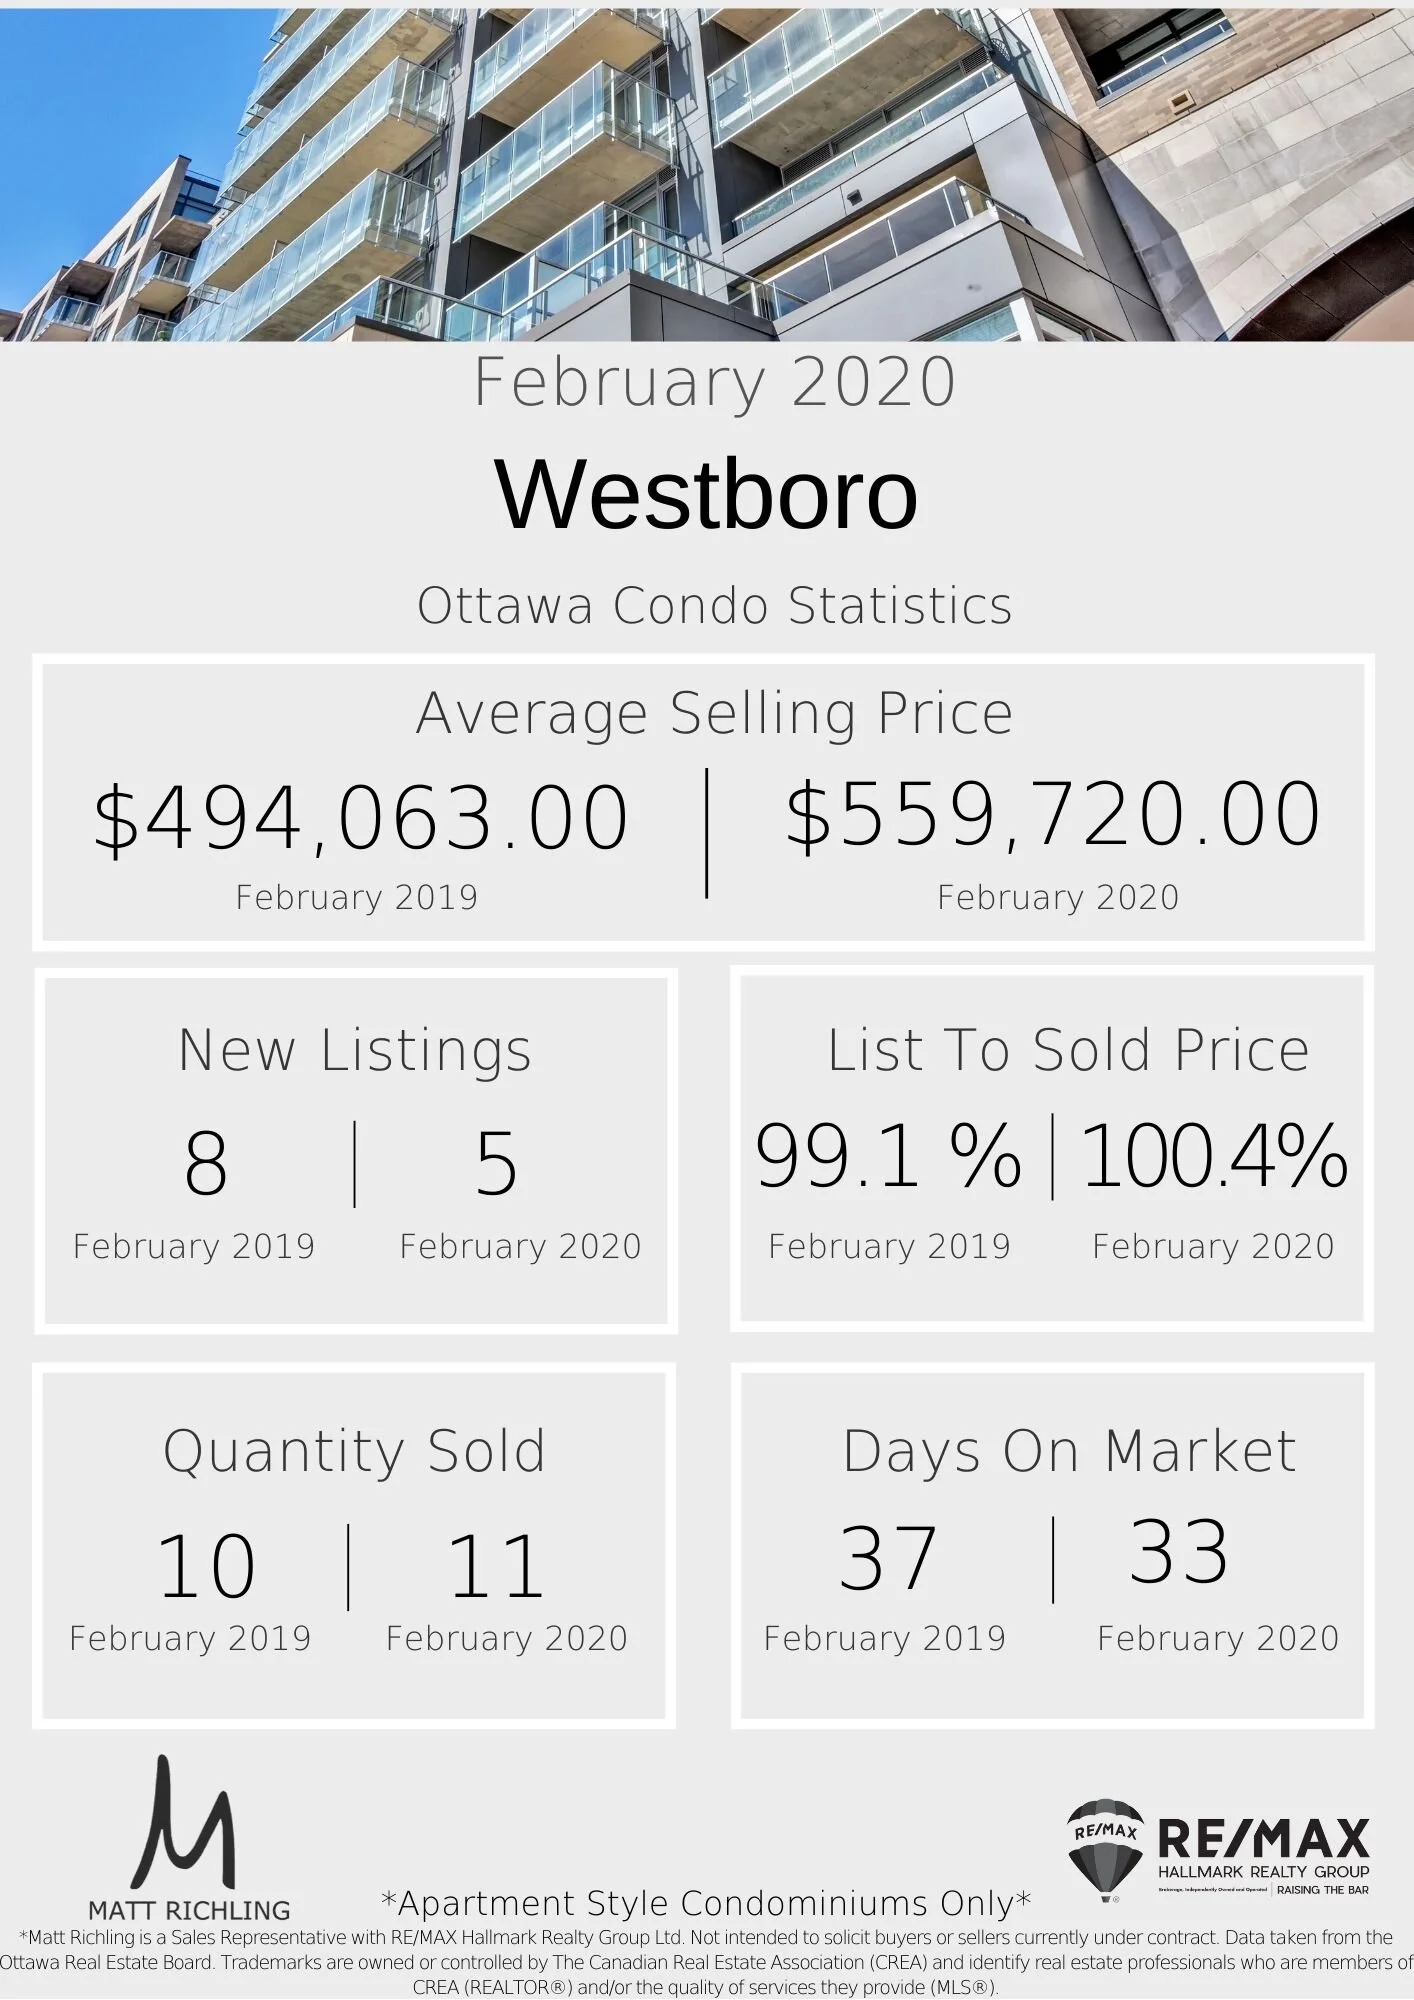
Every month we take a closer look and drill down the sales data of Ottawa condos from the previous month. Here are the statistics for September ‘21 in the top five "downtown" areas - Centretown, Byward Market and Sandyhill, Little Italy (which includes Lebreton Flats), Hintonburg, and Westboro. The information will be specific to apartment-style condominiums, and only what sold through the MLS. Also important to note that DOM (Day's On Market) is calculated to include the conditional period, which in Ottawa is almost every single transaction to be roughly 14 days.
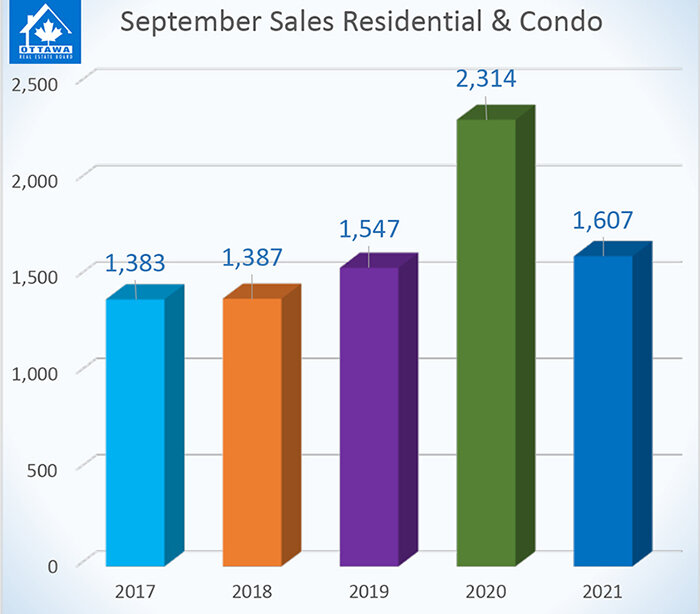
September is a great month … typically. School is back, life is back, and things start to feel normal as we move into the fall market. This year we had the election which always creates uncertainty in the market. However comparing September of 2021 to September of 2020, is not a fair comparisson to due the impact that COVID had on the market in 2020. See the graph below (provided by the Ottawa Real Estate Board) which gives you an idea….
Looking at the data below for September, the average selling price for every area is over $500,000. To me, this is the beginning of the new reality as we see average freehold prices rise across the city, we will start to see the pricing of lower entry-level condo units also rise with increased demand.
Want to chat about your options? Fill out the form at the bottom of the page, or txt/call us directly 613-900-5700 or fill out the form at the bottom of the page.


Do you have any questions about how this information affects your investment or looking for more information to make the best decision about your purchase? Let’s chat! Fill out the form on the bottom of the page.